
In past analyses, North Star Policy Action has examined changes in school funding in Minnesota. We showed how state aid to schools declined steeply from 2003 to 2023, before landmark legislation helped to address the gap. The result was state aid in 2024 coming closer to 2003 levels, though remaining short of the mark. Here, we update our past work using the Minnesota Department of Education’s (MDE) most recent data, examining where school funding stands today and where it is headed. We find:
- State aid to schools remains below its 2003 levels. Across all public school districts, state aid trailed its 2003 level by 8.6% in 2025.
- The 2023 session made meaningful progress. The landmark 2023 school finance legislation reduced the per-pupil aid gap by 56%, moving from $2,834 below 2003 levels in 2023 to $1,249 below in 2025.
- Spending declines have affected nearly every school district and are expected to get worse. 85% of all public school districts received less state aid per pupil in 2025 than they did in 2003. By 2027, that share is projected to climb to 96%.
- Compared to charter schools, public school districts have seen particularly large losses in state aid. In 2025, charter schools received 2.2% less per-pupil aid than they did in 2003. Public school districts received 8.6% less.
- In many places, large increases in property tax levies have offset losses in state aid. Per-pupil property tax levies increased from $1,315 in 2003 to $3,459 in 2025, representing a 163% increase. As a result, statewide per-pupil total revenue grew by 5.6% from 2003 to 2025.
- This increased reliance on levies has created greater dependency on local property wealth to fund schools, deepening inequality across communities. Almost all districts increased their levy from 2003 to 2025, but the scale varies enormously, ranging from increases of over 750% in some communities to slight declines in others. Nearly 40% of districts have lower total revenue today than in 2003 because their state aid losses outpaced what local taxpayers could or would raise.
- Absent legislative intervention, state aid will continue to decline, erasing gains from 2023. Nearly 90% of public school districts are projected to lose state aid between 2025 and 2027. Forecasted losses over these two years sit at $541 per pupil on average, leaving districts $1,791 below their 2003 levels. This represents a 43% widening in the funding gap relative to 2003 and means that districts will receive $1 in aid in 2027 for every $1.14 they received 24 years earlier.
- Our data dashboard provides an account of how these changes occurred for each district in the state. This dashboard can be found at https://northstarpolicy.org/school-funding.
Statewide Aggregate Levels
Figure 1. Per-Pupil State Aid for Public School Districts: Change from 2003 Baseline
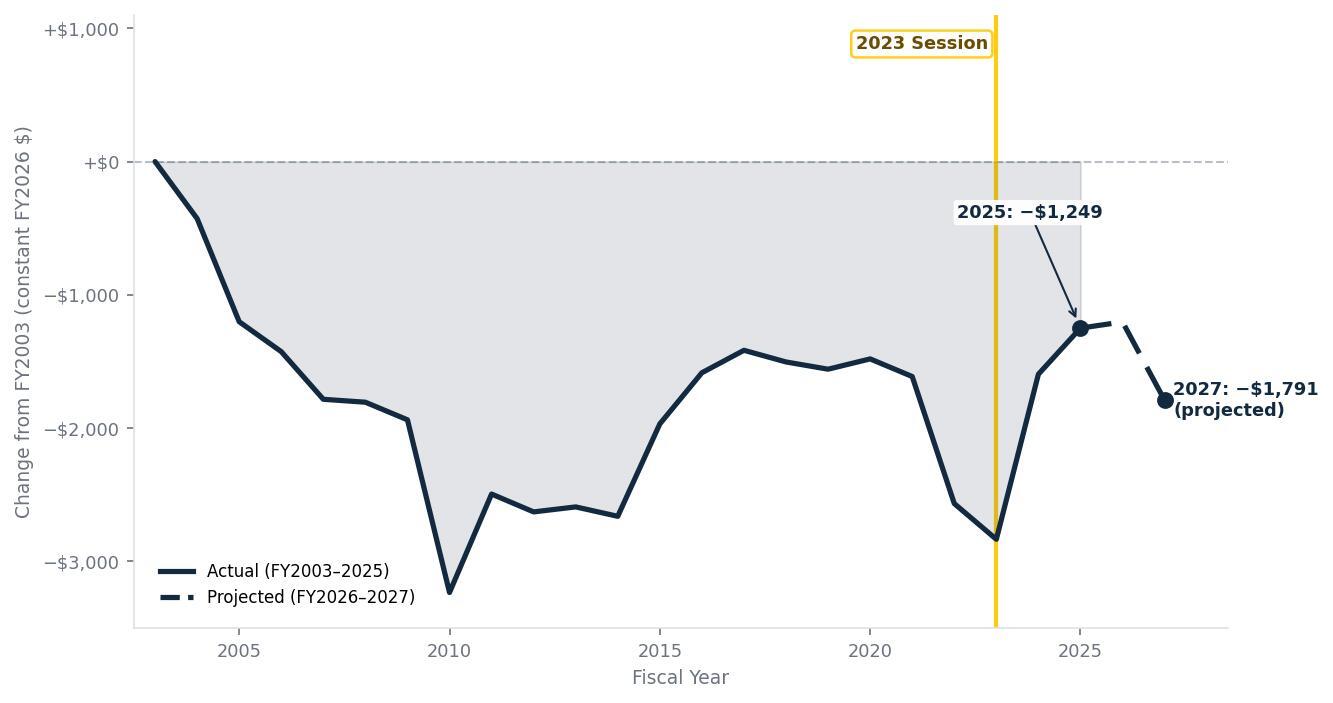
Data are shown in constant 2026 dollars using the implicit price deflator (IPD). Charter schools are excluded. Source: MDE General Fund State Aid & Levy Revenues.
We begin by looking at state aid funding levels to all public school districts across the state. Between 2003 and 2023, real per-pupil state aid fell by $2,834, representing a 19.4% decline. This decline included a sharp dip in 2010 associated with the Great Recession budget crisis, followed by a partial recovery before the decline resumed through 2014. Following modest improvements from Governor Dayton-era investments, aid remained relatively flat from 2015 through 2021, before falling again to reach new lows in 2023.
The 2023 session’s landmark school finance legislation produced the largest single-session boost in state aid in decades. The gap from 2003 funding declined by 56%, falling from $2,834 below baseline in 2023 to $1,249 in 2025. In absolute terms, per-pupil aid increased from $11,748 in 2023 to $13,333 in 2025. According to MDE projections, this investment will continue to narrow the gap through 2026, when aid is projected to come closest to 2003 levels. Following that, aid is expected to decline in 2027, as will be covered in greater detail later in this post.
Public School Districts v. Charter Schools
Figure 2. Difference between Per-Pupil State Aid to Charter Schools and Public School Districts, 2003 to 2025
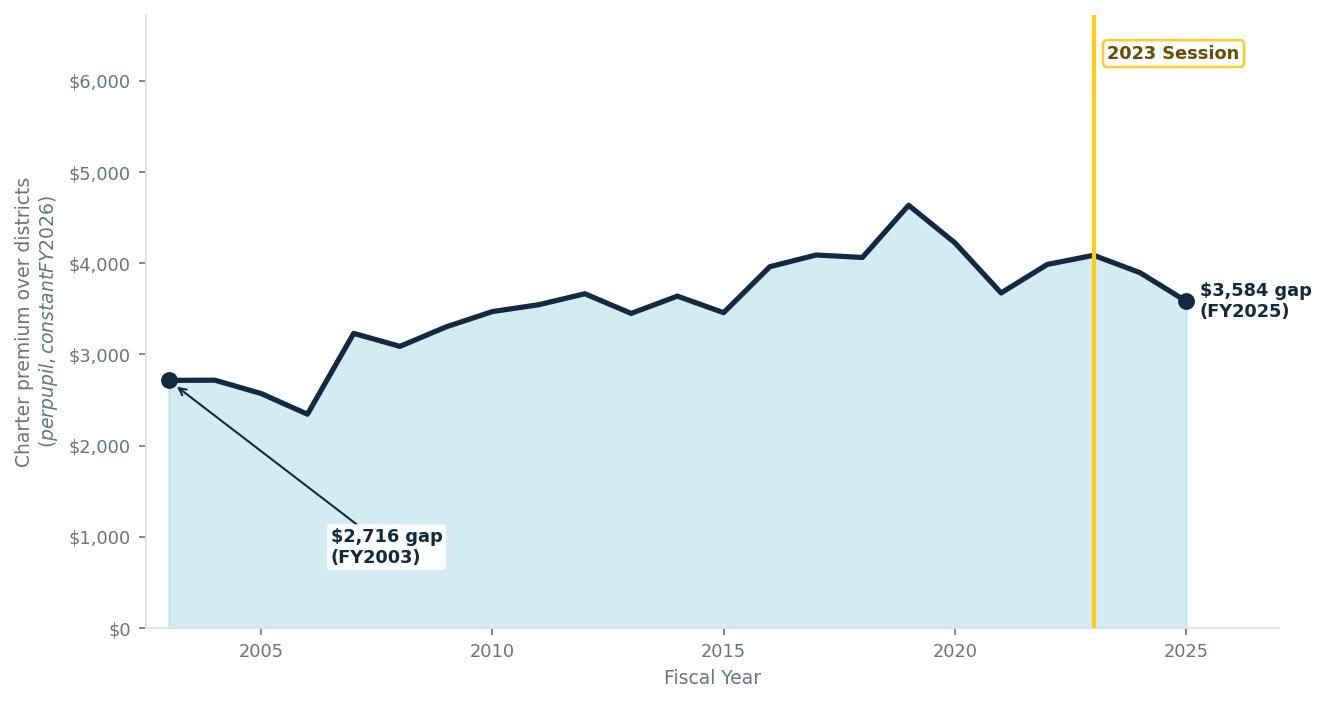
Data are shown in constant 2026 dollars using the implicit price deflator (IPD). Source: MDE General Fund State Aid & Levy Revenues.
As charter schools cannot collect local property tax revenue, the state must provide all operational funding through state aid, meaning they generally receive substantially more per-pupil state aid than traditional districts. In 2003, charter schools received $17,298 per pupil in state aid, compared to $14,582 for school districts.
Between 2003 and 2023, this gap widened considerably, as district aid fell faster than charter aid. Where school districts lost 19.4% of their aid, charter schools lost 8.5% over the same period. As a result, the charter school premium over public school districts grew from $2,716 in 2003 to $4,087 in 2023.
By contrast, the 2023 session disproportionately benefited traditional districts, meaning that charter schools received $3,584 more per pupil than school districts in 2025. While the difference between aid to charter schools and public school districts narrowed, it remains larger than it was in 2003. Moreover, public school districts continue to lag their 2003 funding levels by more than charter schools, with charters now 2.2% below their 2003 aid level, while districts remain 8.6% below.
Looking Across Districts
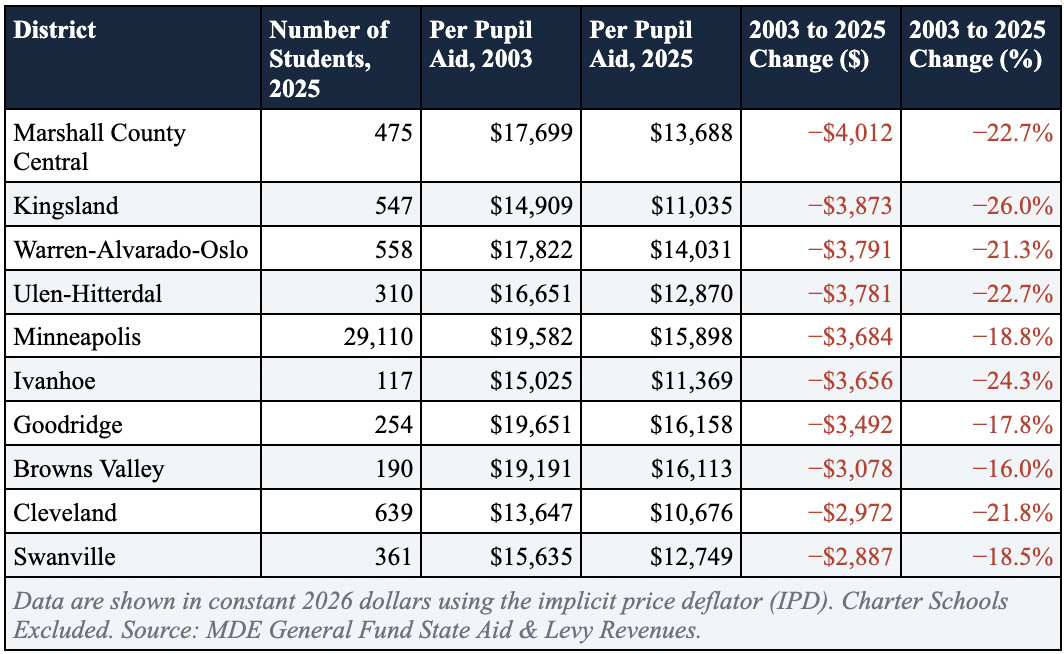
The impact of these funding declines has been widespread, though it has not been uniform. Roughly 85% of all public school districts received less state aid per pupil in 2025 than in 2003. In some districts, losses have been particularly severe. For 42 districts, representing approximately one-in-eight districts across the state, declines led to at least 15% less aid per pupil in 2025 when compared to 2003.
Table 1 shows the ten school districts that experienced the largest dollar decreases in state aid. Of note, many of the hardest-hit districts are in rural communities, though Minneapolis’s inclusion on the list is a reminder that the largest absolute losses are not confined to smaller districts.
Table 1. Ten Districts with Largest State Aid Declines, 2003 to 2025
Increased Pressure on Property Tax Wealth
Figure 3. Per Pupil State Aid, Property Tax Levies, and Total Revenue: Public School Districts, 2003 and 2025
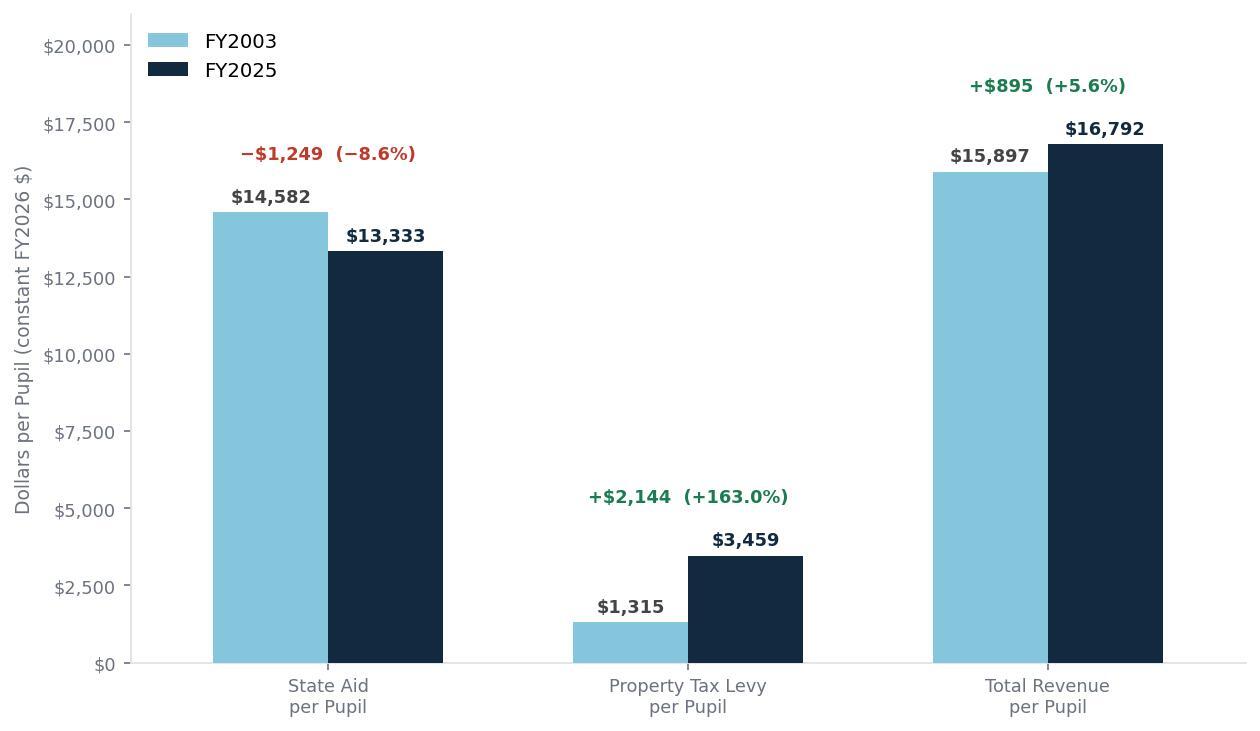
Data are shown in constant 2026 dollars using the implicit price deflator (IPD). Charter Schools Excluded. Source: MDE General Fund State Aid & Levy Revenues.
With declining state aid, school districts have increasingly turned to local property tax levies to maintain their budgets. In real terms, per-pupil property tax levies more than doubled over the past two decades. The statewide average levy rose from $1,315 per pupil in 2003 to $3,459 in 2025, marking a 163% increase. Notably, the average levy increased by more than the average aid decline, generating a 5.6% increase in revenue. But this aggregate figure masks enormous variation across districts.
Statewide, 64% of school districts were able to generate levy increases that offset their state aid losses, while 36% were not. This difference underscores variation in property tax capacity, with wealthier communities generally able to raise more due to higher property values. By contrast, lower wealth communities face a structural disadvantage, forced to either tax residents at higher rates to keep funding levels steady, or accept larger reductions in the resources available for their students.
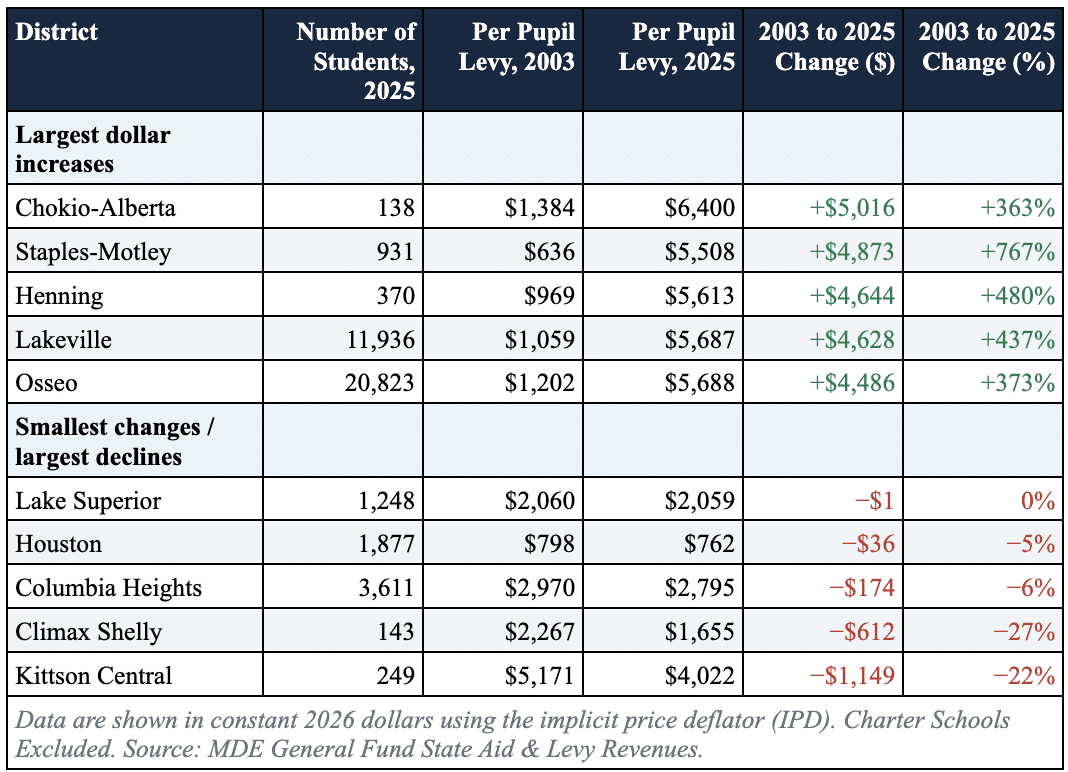
The variation in levy changes across districts illustrates this inequality directly. Table 2 shows the districts with the largest and smallest levy changes between 2003 and 2025. Here, we see levy changes ranging from a $5,016 per pupil increase in Chokio-Alberta to a $1,149 decrease in Kittson Central. Gaps like this reflect both the willingness and capacity of communities to tax local property and raise questions about whether state funding policy is increasingly shifting educational quality to depend on the value of taxable properties, as has been previously argued.
Table 2. Districts with Largest and Smallest Levy Changes, FY2003 to FY2025
A Growing Gap: Projected Funding Levels from 2025 to 2027
While the last two years have provided relief to many schools, the outlook over the next two years indicates a second wave of decline, compressing the modest gains that the 2023 legislative session made possible. Statewide, aid levels are expected to decline by $541 per pupil between 2025 and 2027. The result is a $1,791 shortfall relative to 2003, representing a 43% increase in the funding gap in just two years. That means that school districts will receive $1 in aid in 2027 for every $1.14 they received in 2003.
These projected declines will be widespread, with nearly 90% of districts experiencing a loss from 2025 to 2027. This will leave even more school districts behind their 2003 aid levels, with the share of districts receiving reduced aid jumping from 85% in 2025 to over 96% in 2027.
Notably, this decline comes as school districts are being forced to grapple with certain cost increases, especially in health care, as well as impending cuts to special education funding. In recent years, double-digit percentage jumps in district health care spending ate into the increased state aid provided in 2023, but the forecasted drop in aid combined with rising health care costs and automatic cuts to special education suggest districts will soon be forced to deal with the twin problem of less revenue and larger expenses.
Conclusion
Despite landmark progress in 2023, Minnesota’s school funding system has not yet restored the ground lost since 2003, and MDE’s forecast projects the gap will widen again in the next two years. The 2023 session demonstrated that legislative investment can make a significant difference, reducing a per-pupil aid gap that had grown over decades by 56% in just two years. But without further action, that progress will erode, and districts will again be left further behind their 2003 funding levels, especially as they confront growing health care costs and cuts to special education funding that will eat into their revenue.
Importantly, the shift toward property tax levies as a substitute for state aid is neither a sustainable nor equitable solution. Nearly 40% of districts have not been able to fully compensate for aid losses through levies, resulting in lower total revenue today than in 2003. Absent additional legislative investment, children living in working-class communities with limited property wealth who need the most help will bear a disproportionate share of the burden of state aid shortfalls.
Appendix: Data and Methods
Data sources. This analysis draws on the Minnesota Department of Education’s (MDE) General Fund State Aid and Levy Revenues spreadsheets. Data for 2003 to 2019 are from the February 2025 forecast, while data for 2020 to 2029 are from the February 2026 forecast. Only data through 2025 represent actual funding levels, while 2026 to 2029 are MDE projections.
Inflation adjustment. All dollar figures are expressed in constant 2026 dollars using MDE’s Implicit Price Deflator (IPD), which MDE publishes alongside the revenue data.
Per-pupil denominator. All figures are expressed per Adjusted Average Daily Membership (AADM), which is MDE’s standard measure of district enrollment. All analysis excludes public school districts with an AADM below 100.
Revenue, aid, and levy definitions. “Combined Revenue” represents total general fund revenues from state and local sources, calculated by summing applicable MDE Report Data line items: state aid components (lines 2–30, 32–39, 44–57), miscellaneous levy components (lines 82–91), and facility levy components (lines 72–74). “Combined Levy” includes all property tax levy components (lines 61–75, 82–91). “Combined Aid” is the difference, representing state-sourced revenue only, and is the primary metric used in this analysis.
District scope. The statewide aggregate figures use MDE’s aggregate code 9007, which represents the sum of all traditional school districts, excluding charter schools. Charter school figures use MDE’s aggregate code 9008.
Projections. Figures for 2026 and beyond are MDE forecasts and are labeled as projections throughout. Forecasts are subject to change based on enrollment trends, legislative action, and other factors.