By Aaron Rosenthal, North Star Policy Action and Aaron Sojourner, W.E. Upjohn Institute for Policy Research
Introduction
Reporting on Operation Metro Surge (OMS) in Minnesota has focused on economic harm to several industries with large immigrant worker populations, including construction, child care, and agriculture. But one industry has appeared particularly hard hit: restaurants. Across the state, reports have described restaurants losing significant revenue, cutting workers’ hours, and, in some cases, closing entirely.
Up until now, this reporting has been largely anecdotal or has documented only the absolute change in employment in Minnesota. By contrast, this research brief uses more credible methods to compare Minnesota to similar states and isolate the specific harm OMS did to the state’s leisure and hospitality industry, which includes restaurants, hotels, and tourism.
In the first three months of 2026, Operation Metro surge caused Minnesota’s leisure and hospitality sector:
- To lose approximately 4,600 jobs.
- To lose 3% of weekly hours among employees who kept their jobs, leading to 2.6 million hours of lost work in the sector.
- Together, these jobs and hours effects translate into 3.8 million total working hours lost in the industry.
- Applied to industry averages, this implies that $71 million in wages were lost in Minnesota’s leisure and hospitality sector across January, February, and March of 2026.
Methods: Synthetic Difference-in-Differences Analysis
As explained in past work, a synthetic difference-in-differences (SDID) analysis compares Minnesota’s observed trajectory to that of a “synthetic Minnesota,” which is created by utilizing a weighted average of other states. The weights are chosen so that synthetic Minnesota’s trajectory on any outcome of interest (in this case, labor outcomes in the leisure and hospitality industry) aligns with real Minnesota’s trend during the years and months before OMS. After OMS’s start, any gap that emerges between real Minnesota and synthetic Minnesota provides an estimate of the operation’s impact. Because synthetic Minnesota moves like real Minnesota before OMS and there were no other large shocks to hit Minnesota besides OMS at the same time, its path provides a credible estimate of what would have happened in real Minnesota without OMS.
The data used here comes from the U.S. Bureau of Labor Statistics (BLS) monthly, gold-standard employer survey, the Current Employment Statistics (CES) program’s State and Metro Area Employment, Hours, and Earnings series. We draw on the May 2026 release, which reports monthly data through March 2026. The data series used here includes all 50 states plus the District of Columbia and begins in January 2007, giving us a large pre-treatment period that allows for strong alignment between synthetic and real Minnesota prior to the start of OMS.
A Note on Scope
All of the SDID results presented here use January through March 2026 as the treatment period. ¹ While we discuss the findings below in substantive terms, all of the estimates presented reach traditional levels of statistical significance (p < .05), suggesting the analysis is likely capturing something real and not merely noise.
By contrast, we also ran models looking at changes in jobs and average weekly hours for the entirety of Minnesota’s private sector. Those results also estimated a negative impact from OMS, but indicated a proportionally smaller reduction in jobs and hours that did not reach conventional levels of statistical significance. The absence of significant economic decline at this highly aggregated level (i.e., the whole private sector across the entire state) likely reflects the more targeted nature of OMS’s impact, both in terms of industries (e.g., leisure and hospitality) and geography (e.g., the Twin Cities, Rochester, and St. Cloud). When treatment is concentrated in particular places and sectors, it can be hard to detect in statewide aggregates.
Jobs
Before getting into the SDID analysis, consider trends in the raw job count data. In the first three months of 2026, Minnesota lost 5,800 jobs in leisure and hospitality, posting job losses in the sector every month. That represents a 2.1 percent decline, the largest percentage decline in the nation over this period. By contrast, during the same months, the United States gained 38,000 jobs in the industry, representing a 0.2 percent increase.
Figure 1 plots the divergence. Through most of 2025, monthly leisure and hospitality employment in Minnesota rose and fell but generally stayed close to its January 2025 level. Starting in December 2025, the month that Operation Metro Surge officially began, the Minnesota and national trajectories began to pull apart. This divergence then accelerates, as U.S. employment continues to drift upward while Minnesota employment falls in every successive month through March 2026.
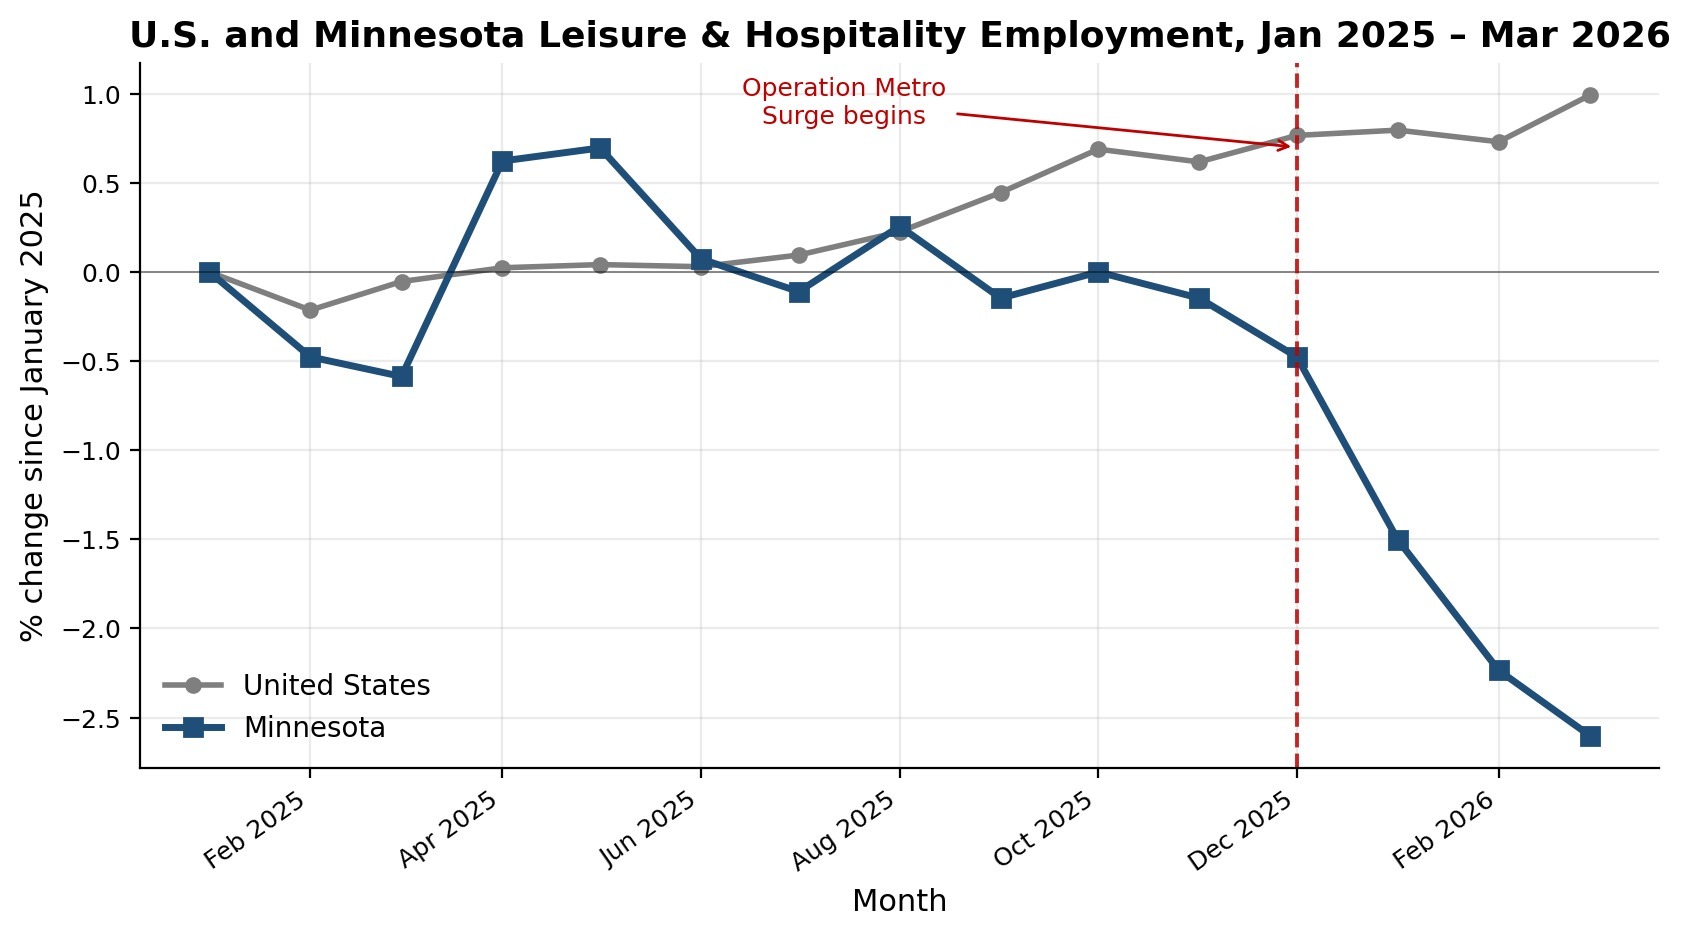 Figure 1. Percent change in monthly leisure and hospitality employment, indexed to January 2025. The vertical red line marks December 2025, the month before the surge of DHS agents to Minnesota. Source: BLS State and Metro Area CES (May 2026 release).
Jobs SDID Analysis
The trends above reveal a decline in Minnesota’s leisure and hospitality employment, but they do not definitively connect that decline to OMS. The U.S. trend does not represent what would have happened in Minnesota absent OMS. To isolate the impact of the DHS agent surge during OMS, we turn to SDID analysis, comparing leisure and hospitality employment in a synthetic Minnesota constructed from similar peer states to industry jobs in real Minnesota.
The SDID analysis finds that leisure and hospitality jobs in Minnesota fell by an average of 1.7 percent across January, February, and March 2026, relative to expected change based on states with similar trajectories leading up to January. Figure 2 shows how this effect played out month by month. The monthly “effect” estimates in the months prior to January 2026 are placebo effects. For these months, there shouldn’t be an effect because OMS hadn’t started yet. Thus, they give a sense of how well the synthetic Minnesota model, based on matching prior years’ data, works at predicting what would happen in the real Minnesota in the year before OMS started. That these estimates fluctuate around zero indicates a strong match between synthetic and real Minnesota in the time leading up to the surge of federal agents into the state.
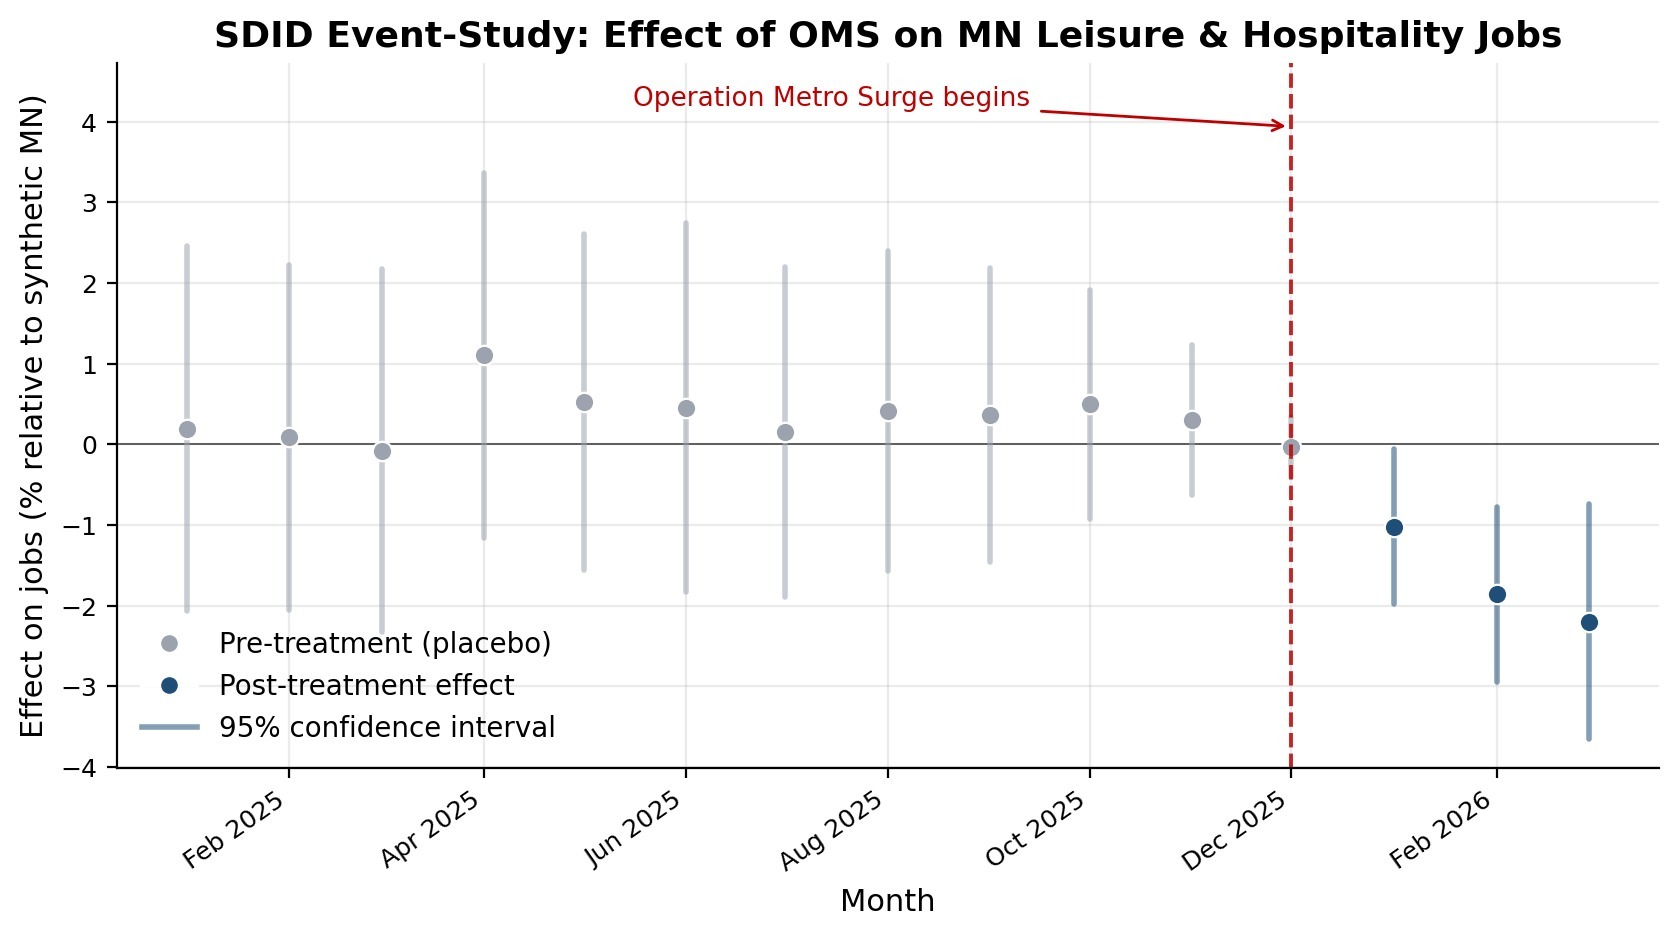
Figure 2. Monthly estimates of the effect of OMS on Minnesota leisure and hospitality employment, relative to synthetic Minnesota. Gray points are pre-treatment placebo estimates; dark blue points are the post-treatment effects in January, February, and March 2026. Vertical bars denote 95 percent confidence intervals.
Negative effect estimates start appearing only in January 2026, coincident with the DHS agent surge, lending credibility to the model. The increasingly negative effect estimates from January to March of 2026 do not imply that monthly job losses grew larger. Rather, it indicates that the gap between the real Minnesota and the synthetic one widened over time. This points toward a weak recovery for Minnesota’s leisure and hospitality industry, suggesting that the impact of the surge has persisted even as the DHS agent surge subsided. This pattern aligns with an understanding of labor markets, in which hiring rebounds take time and a one-time shock can create an extended impact.
Applied to the number of jobs in the state’s leisure and hospitality sector in the months leading up to OMS (272,500 in November 2025), an average effect of 1.7 percent implies roughly 4,600 jobs lost relative to the counterfactual in which OMS did not take place. That Minnesota actually lost 5,800 jobs in the industry between December 2025 and March 2026 suggests that the state would have seen about 1,200 jobs lost during the first three months of 2026 in the absence of OMS. The remaining 4,600 lost jobs can be credibly attributed to the federal action (and any significant coincident changes, of which we can think of none).
Leisure and Hospitality Hours
Beyond the loss of jobs, a second concern is that workers who kept their jobs had the jobs go dormant as demand and labor supply dried up or as they stayed home due to fear, resulting in fewer hours worked per job. As we noted in previous work, average weekly hours in January 2026 across the entire private sector hit their lowest level in Minnesota since at least 2007. Again, we begin with descriptive trends and then move to SDID analysis.
The same pattern shows up in the leisure and hospitality sector. While January 2026 did not represent the lowest average hours worked in the industry, it was the lowest level in over three years, matching the low hit in December 2022. To find a value lower than January 2026, one must go back to April 2020, the height of the initial COVID-19 wave.
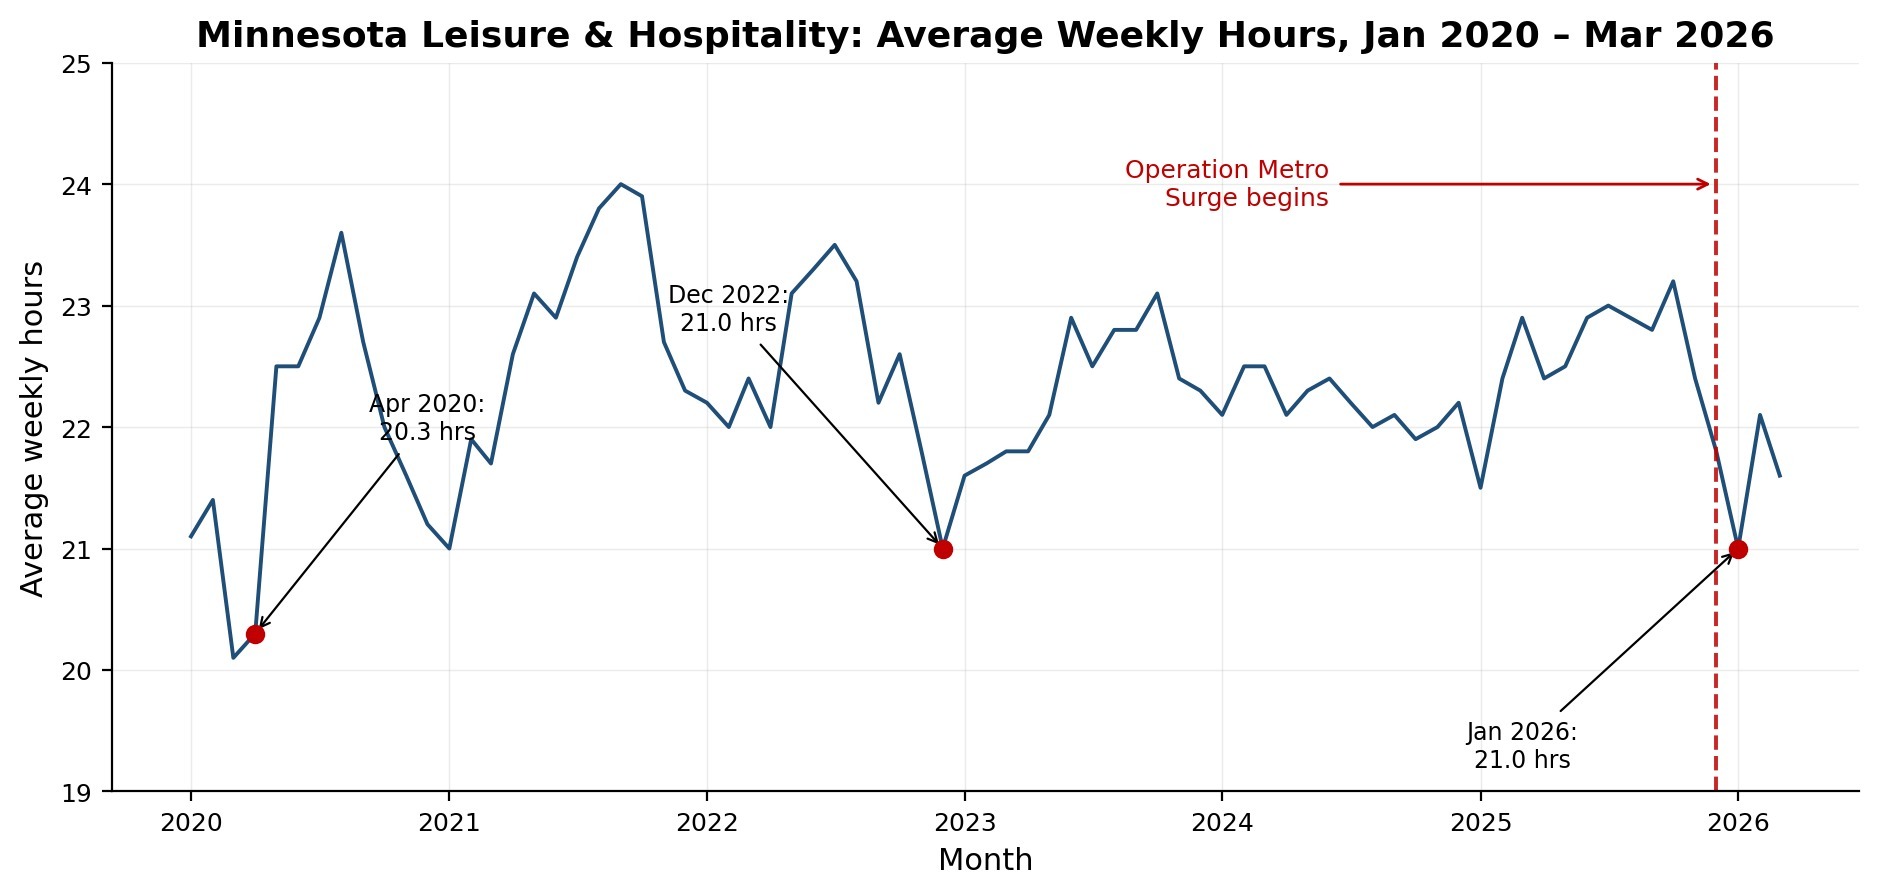 Figure 3. Average weekly hours of leisure and hospitality employees in Minnesota, monthly, not seasonally adjusted. Red points mark April 2020 (COVID-19 low), December 2022 (prior recent low), and January 2026 (post-OMS low). Source: BLS State and Metro Area CES (May 2026 release).
Minnesota also diverged from the national trend during this period. Nationally, hours worked in the leisure and hospitality sector dipped by 1.6 percent from December to January, well short of the 3.7 percent drop in Minnesota. While average hours in the industry have recovered somewhat since, they remained below the national trend in March.
Hours SDID Analysis
SDID analysis of average weekly hours reveals that employees in the sector worked approximately 3.3 percent fewer hours in the first three months of 2026 than they would have absent OMS. This is a substantively larger decline than the jobs estimate, reflecting the idea that more harm was done through workers being unable to show up to work at their normal hours, as opposed to losing their jobs outright.
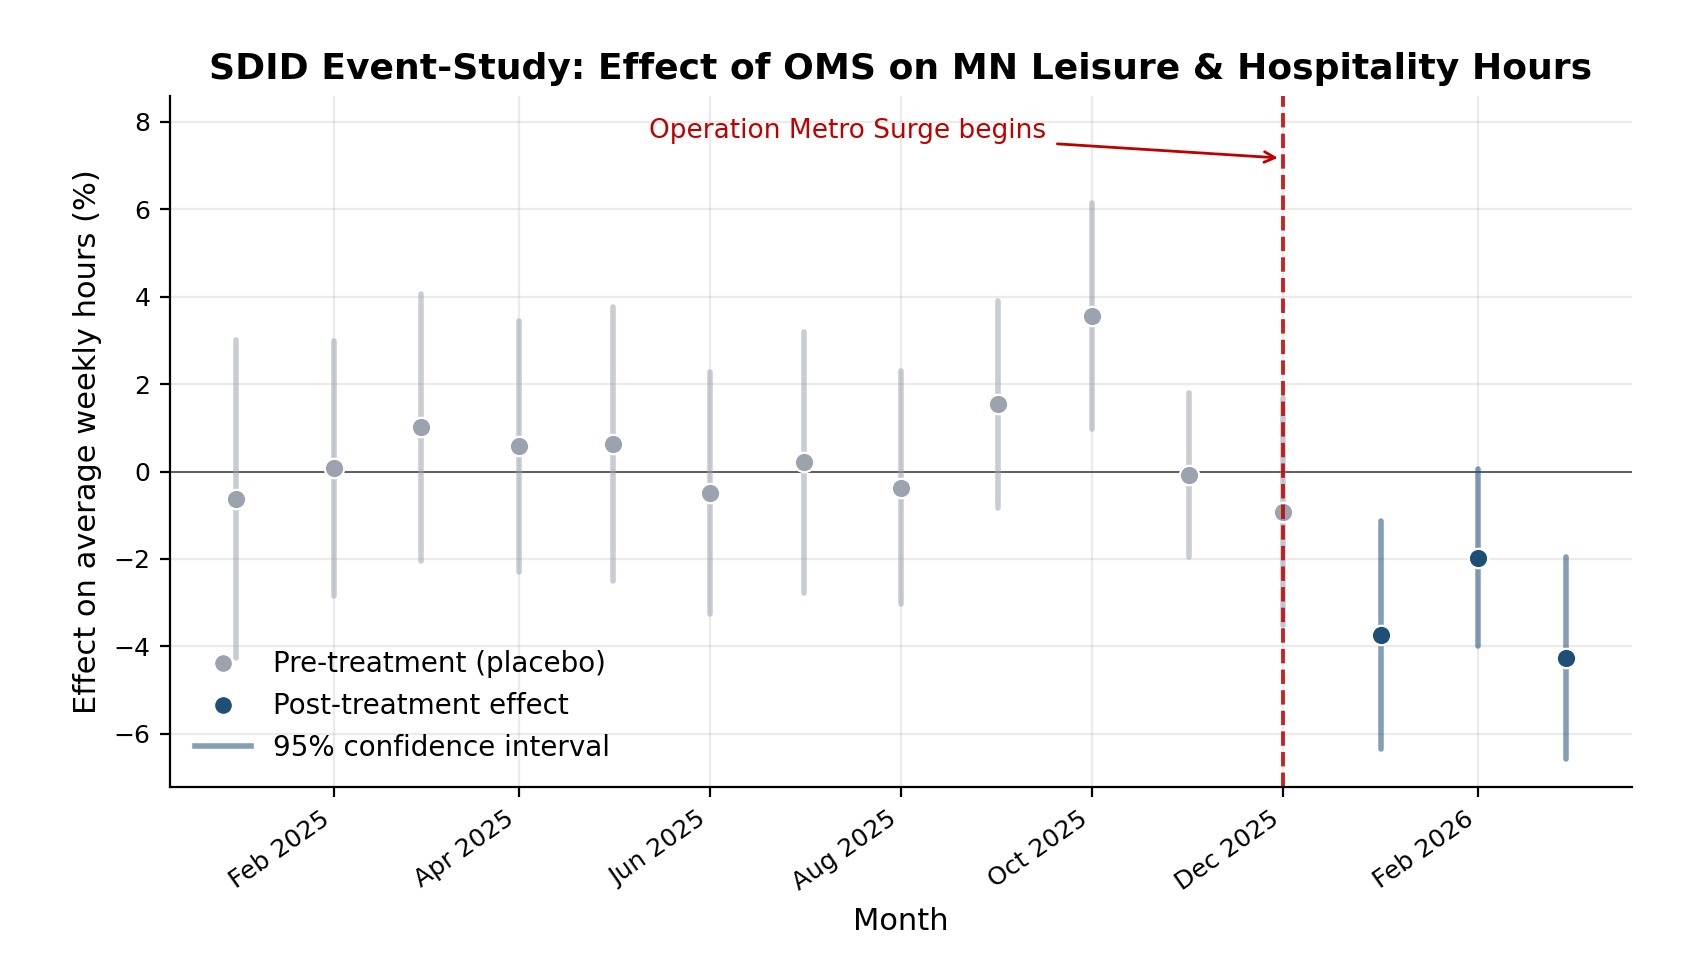 Figure 4. Monthly estimates of the effect of OMS on Minnesota leisure and hospitality average weekly hours, relative to synthetic Minnesota. Gray points are pre-treatment placebo estimates; dark blue points are the post-treatment effects in January, February, and March 2026. Vertical bars denote 95 percent confidence intervals.
Applied to the total worker hours in the industry in the months leading up to OMS (roughly 6.1 million weekly hours in November 2025), the estimated 3.3 percent decline implies that Minnesota’s leisure and hospitality sector lost over 2.6 million hours in the first three months of 2026.
Figure 4 reveals a slight recovery in February, preceding a decline in March that has kept real Minnesota’s average working hours depressed relative to synthetic Minnesota.² As with the jobs estimate, these results do not necessarily imply that the absolute harm was worse in March than in February. Rather, relative to synthetic Minnesota, average working hours in real Minnesota remained low in March.
Jobs × Hours: Total Employee Hours
To capture the simultaneous effect of both job loss and reduced hours, we examine the product of employment and average weekly hours, which equals total employee hours in the industry. SDID analysis on this combined measure suggests that total worker hours declined by 4.8 percent in the first three months of 2026 relative to the synthetic counterfactual. This larger substantive impact makes intuitive sense, as it bundles together both the lost jobs and reduced hours channels.
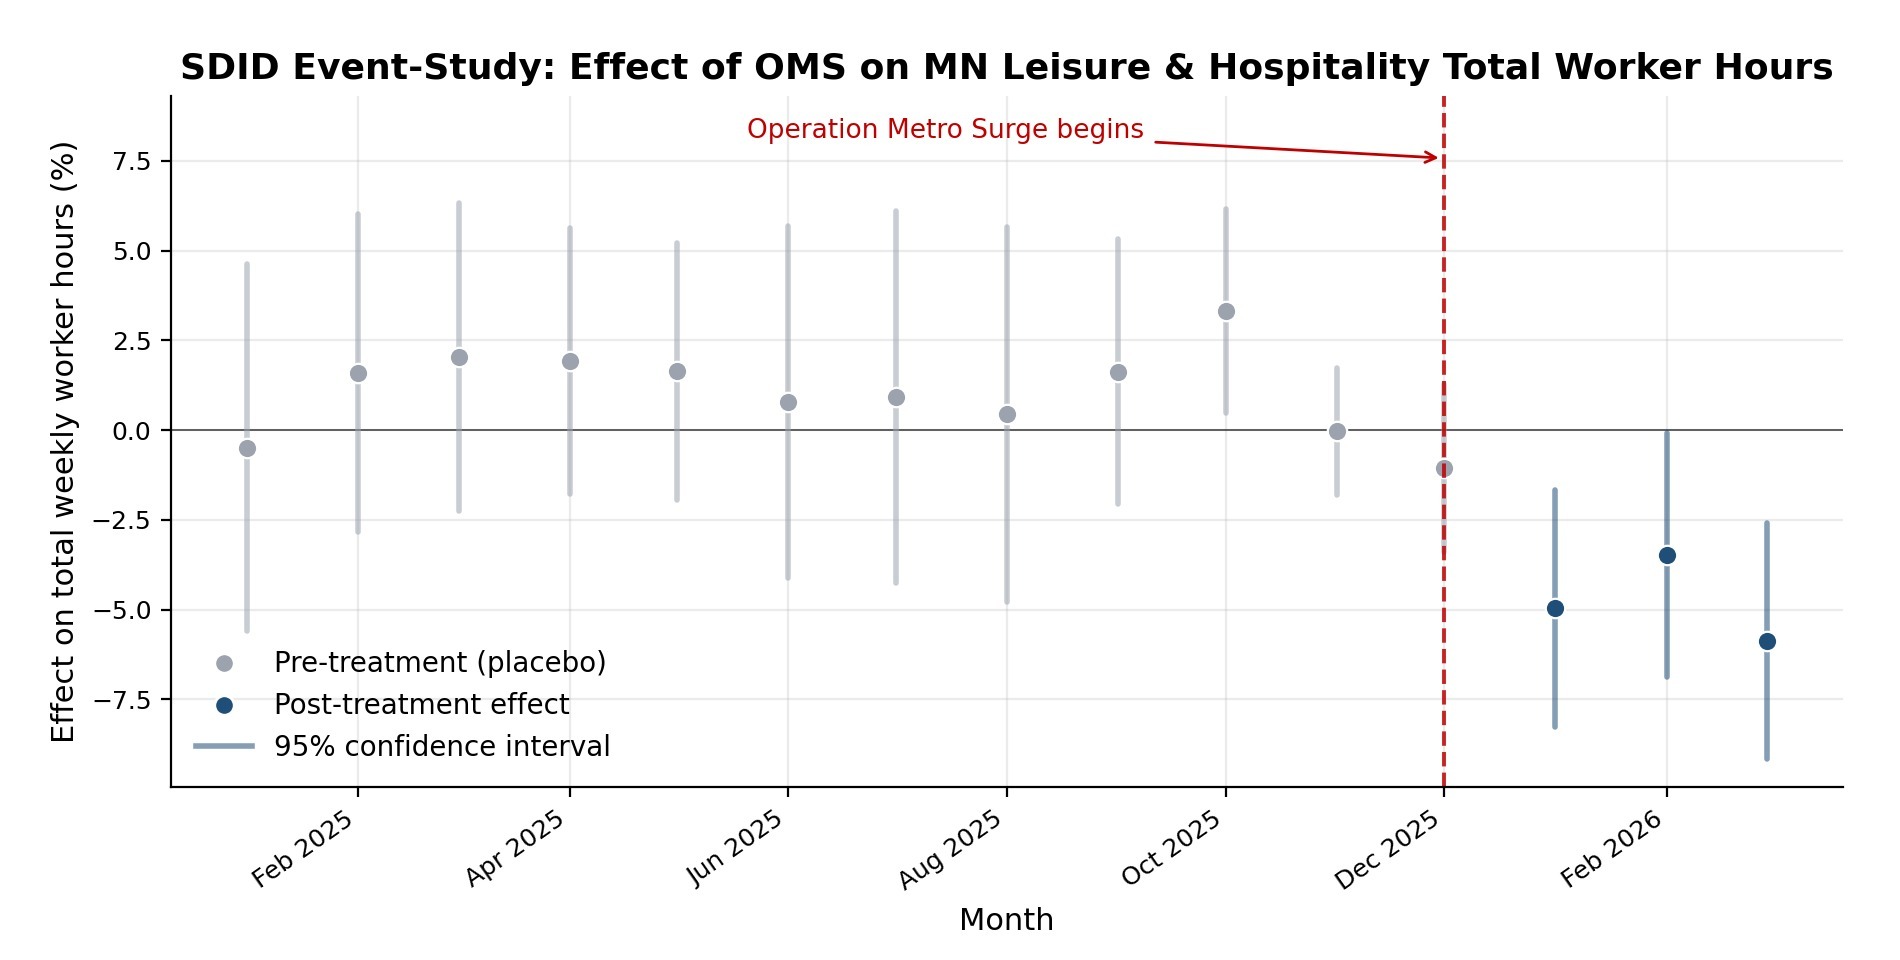 Figure 5. Monthly estimates of the effect of OMS on Minnesota leisure and hospitality average weekly hours, relative to synthetic Minnesota. Gray points are pre-treatment placebo estimates; dark blue points are the post-treatment effects in January, February, and March 2026. Vertical bars denote 95 percent confidence intervals.
Applied to the total employee hours in the sector leading up to OMS, this impact indicates a decline of nearly 3.8 million total hours in the first three months of 2026.
Earnings impact
Finally, to estimate the dollar value of this harm, we combine three factors: jobs × average weekly hours × average hourly wages. This product captures the total weekly earnings paid in the sector each month.
SDID analysis on this measure indicates that total weekly earnings in Minnesota’s leisure and hospitality sector declined by 3.7 percent from January through March 2026. Applied to industry totals leading up to OMS, this percentage decline indicates that total earnings in the sector fell by $71 million across the first three months of 2026.
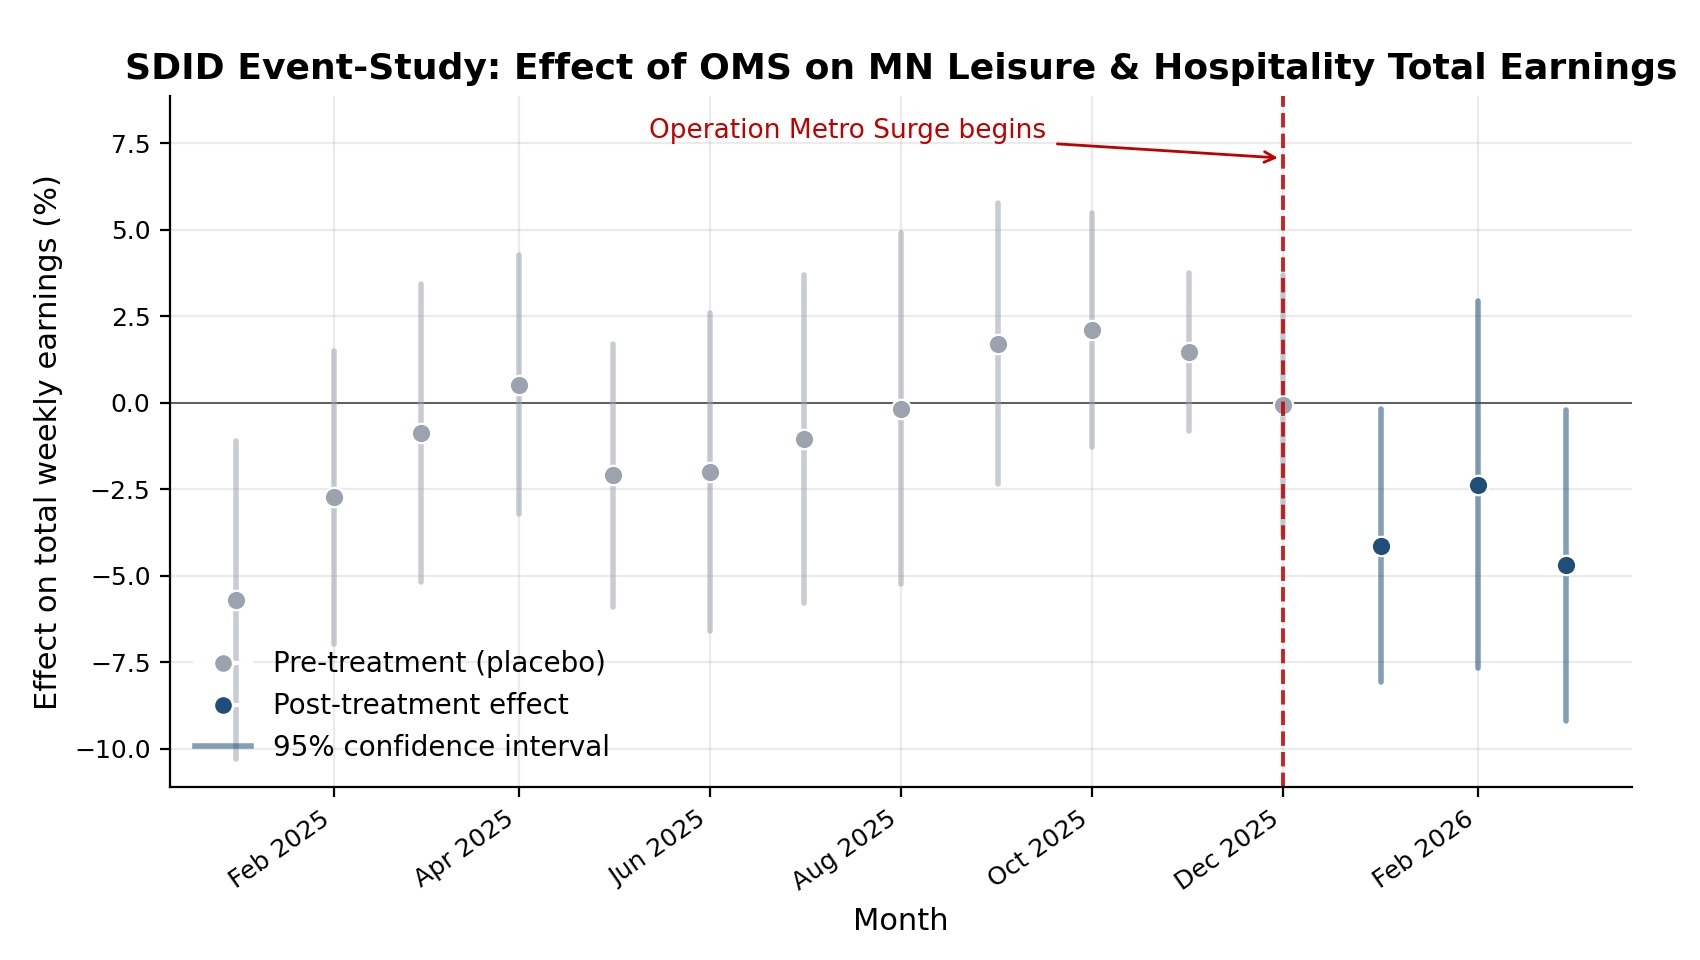 Figure 6. Monthly estimates of the effect of OMS on Minnesota leisure and hospitality average weekly hours, relative to synthetic Minnesota. Gray points are pre-treatment placebo estimates; dark blue points are the post-treatment effects in January, February, and March 2026. Vertical bars denote 95 percent confidence intervals.
Notably, leisure and hospitality accounts for 8.7 percent of the state’s workforce and is one of the lowest-paid sectors in the state, meaning the lost wages are likely to be relatively small in dollar terms even when a large share of the workforce is affected. Given that these jobs provide relatively low wages, even modest declines in earnings can create profound challenges for the industry’s workers, who often live paycheck to paycheck.
Conclusion
Our analysis suggests that Minnesota’s leisure and hospitality industry was the most deeply impacted sector in the state by OMS.³ Recovery has remained slow according to data through March 2026. If and when recovery does happen, it will not be aided by the federal government nor the state, given both Congress and the state legislature’s failure to provide resources to help those affected by OMS.
Robustness Checks
To test that these results reflect the impact of OMS and are not simply an artifact of the season or some idiosyncrasy of Minnesota, we also ran SDID analyses on the first three months of 2025 and 2024 as a robustness check. In nearly every case, those analyses produced no statistically significant decline, and the point estimates were often signed in the opposite direction (suggesting modest, statistically insignificant relative increases in jobs and hours).
The one exception was a marginally significant negative effect on leisure and hospitality jobs in the first three months of 2025. Because that effect was not accompanied by the same reduction in hours and was not present in the first three months of 2024, we remain confident that the results presented here are capturing something specific to OMS.
Endnotes:
- We also ran models that defined the treatment window as just January 2026, and as January and February 2026 only, reflecting the intensity of the Department of Homeland Security’s (DHS) actions during those months. Models focused on just those months produce similar results to the ones presented below. We ultimately decided to include the full three-month window because the numbers indicate that the leisure and hospitality sector had still not fully recovered as of March.
- The estimated effect for February 2026 falls just outside of traditional levels of statistical significance. This can be seen in Figure 4, where the confidence interval for the February estimate crosses 0. However, as our treatment period consists of January, February, and March, our measure of interest as it relates to statistical significance is the average effect across those three months, which remains significant at the p<.05 level. This same logic can be applied to the remaining figures, in which February’s estimate also falls out of statistical significance, indicating a slight recovery during that month but not one that cancels out the decline across the entire three-month period.
- Our claim that the leisure and hospitality sector was the most impacted stems from similar SDID analysis we ran for other industries in the state. In general, these results revealed more substantial and consistent damage done to the leisure and hospitality sector relative to other areas of the state’s economy.