
Introduction
Standardized tests have become a central way of measuring student performance in America, with substantial media and political attention focused on the results to evaluate how well our kids are learning. While tests can provide insight into student progress, we often overlook challenges associated with them. One issue of note in Minnesota is the substantial number of students who do not complete tests, either because they refuse to take it or are absent from school. Notably, federal standards call for at least 95% participation, providing a threshold below which we might call into question the reliability of the results provided by a test.¹
In this research brief, we explore the non-participation rate for the Minnesota Comprehensive Assessments (MCAs) to evaluate the capacity of these tests to effectively capture the performance of schools in the North Star State.
Key Findings
- Non-participation rates are high at many Minnesota public schools. In some places, grade-level MCA tests have non-participation rates of 60%.
- This issue is not isolated to one area or type of school. High non-participation rates show up in schools with large and small student bodies, and in urban, suburban, and rural areas.
- The driver of non-participation varies across schools. Suburban and rural schools tend to have a larger number of students refusing to take tests, while urban schools suffer more from non-participation due to absences.
- Non-participation starts early. While non-participation rates are generally higher in high school, multiple schools in the state have non-participation rates above 20% starting in 8th grade or earlier.
- Non-participation is not new, but it has grown. Non-participation rates were high in pre-pandemic years, but they have risen since. In 2019, fewer than one-in-twenty-five Minnesota grade-level reading tests failed to meet the federal government’s 95% participation threshold. In 2025, that rate more than tripled, such that one-in-nine of the state’s grade-level reading tests no longer met the federal standard, including 40% of all 10th grade tests.
- Certain types of schools have higher non-participation rates. More than 21% of grade-level reading tests in charter schools, and 45% of tests in schools focusing on special education, do not meet the 95% federal standard, far exceeding the 11.5% rate in traditional public schools.
- These high non-participation rates should be considered when interpreting the results of MCA tests. At a minimum, parents and policymakers should be asking “what are we even measuring?”
The Issue of Non-Participation in Standardized Testing
In Minnesota, statewide standardized testing comes in the form of the Minnesota Comprehensive Assessments (MCAs). The MCAs comprise standardized tests in reading, math, and science, and are administered to students in select grades.
Like many states, Minnesota law gives parents and students the ability to refuse, or “opt out” of, state MCA testing.² This provision gives families more flexibility to choose what fits for them, but it also creates a potential issue for schools, as it can drive down who completes the test in their schools. Given that these tests are used to evaluate school performance, there is reason to be concerned.
For example, if the individuals dropping out of testing are more likely to be higher-performing students, it will drag down a school’s performance. Alternatively, if lower-performing students are more likely to refuse the test, a school will look artificially better. Either of these scenarios create an issue of “selection bias,” wherein results are unreliable because the population of students completing the test does not align with the school’s student body. While we cannot analyze which of these may be happening in Minnesota, either option raises the possibility that greater non-participation leads to test results that fail to accurately measure a school’s performance.
We are not the first to suggest this could be problematic in Minnesota. A 2017 report from the Office of the Legislative Auditor (OLA) pointed to this issue.³ In analyzing Minneapolis Public Schools, the OLA found that more than 55% of eligible 10th-grade students and more than 60% of eligible 11th-grade students in Minneapolis Public Schools did not take their reading and math MCAs, respectively. They concluded that “The level of testing nonparticipation among high school students in Minneapolis Public Schools has reached the point where it is no longer appropriate to endorse the test results as a valid measure of districtwide student learning” (OLA, Standardized Student Testing, March 2017, p. 79). Notably, the OLA report dug into this issue further and found that it was certain types of students who were more likely to refuse the test, creating the kind of selection bias problem described above.
Given these past findings, our analysis is designed to investigate how broad non-participation is in the state today. To the extent that non-participation rates are high and common, we feel it is essential that both parents and policymakers raise questions about how well these tests are measuring student and school performance in Minnesota.
Data and Methods
The results presented below show non-participation rates on MCA reading tests. Our focus on reading stems from a desire to provide a more concise report and the greater emphasis that is placed on reading tests by those using test results to evaluate school performance. We also ran the same analysis for MCA math tests and found that the results follow a similar pattern, though non-participation rates run somewhat higher for math tests than reading tests, meaning that our findings presented below generally understate the prevalence of non-participation. The full math results are available in the report’s appendix. All data are taken from the Minnesota Department of Education’s (MDE) MCA public reporting files. ⁴ More detail on the data and methods used in this analysis can be found in the supplemental appendix.
Non-Participation Rates in Traditional Public Schools
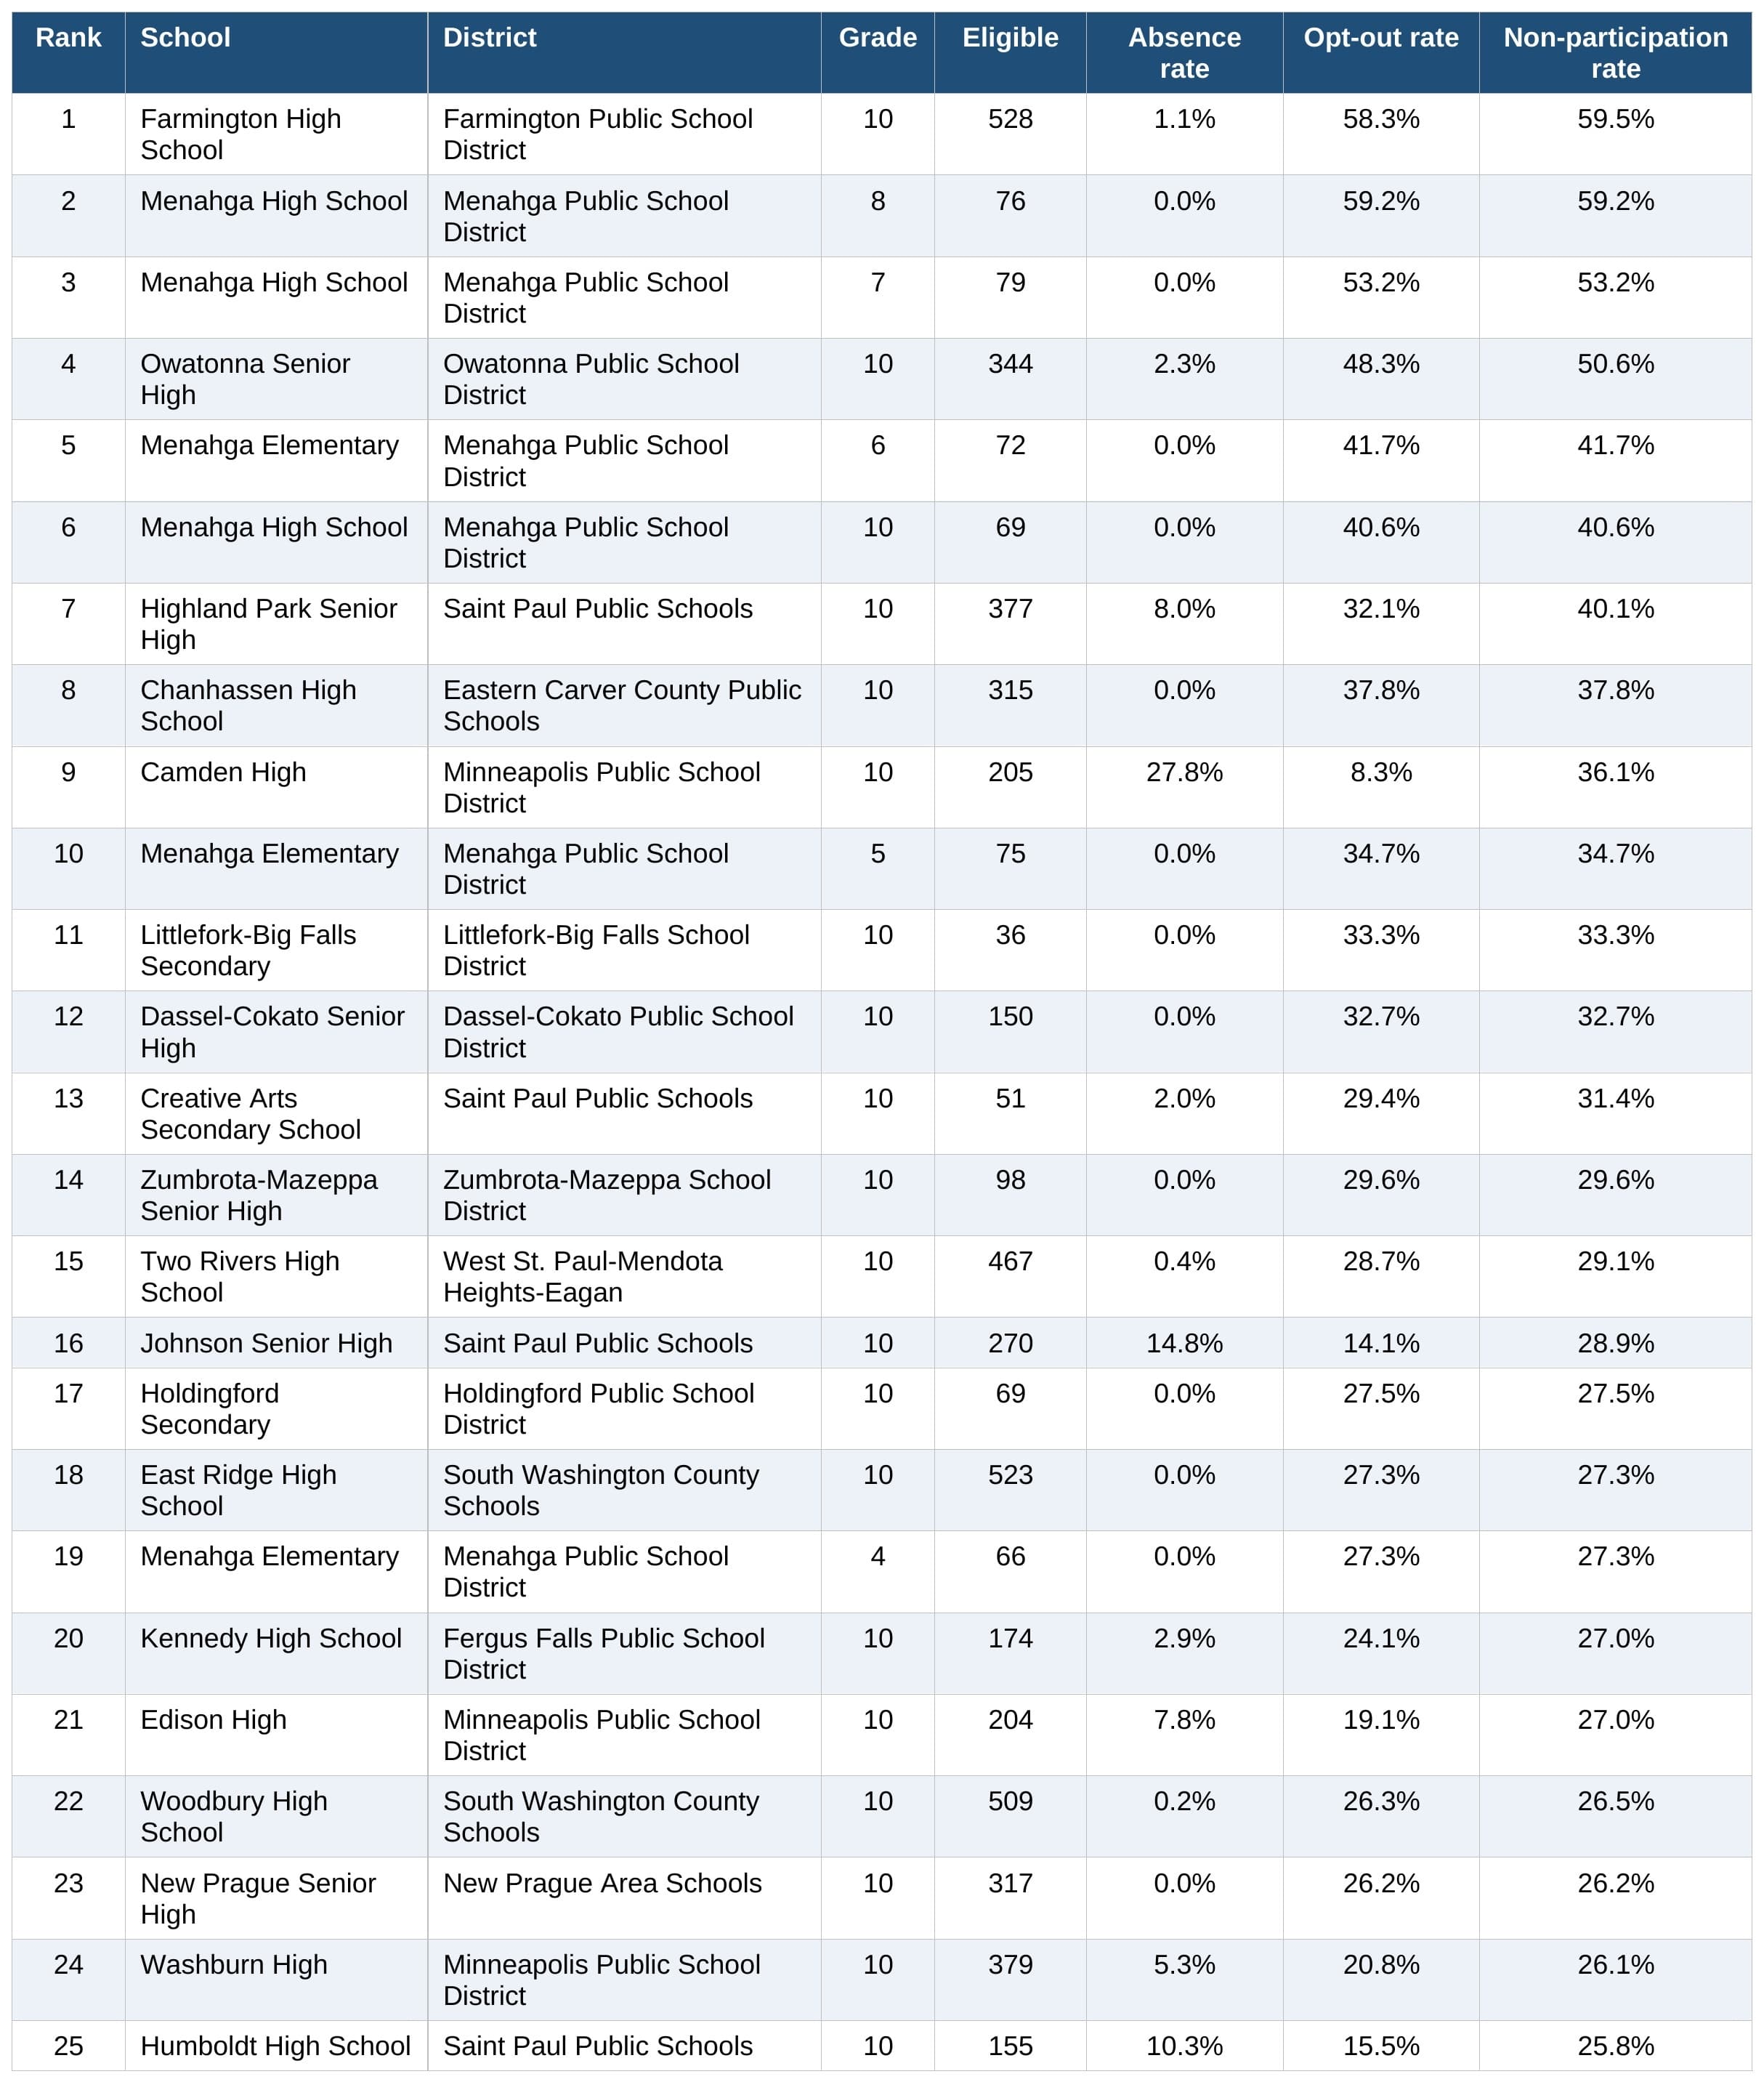
Our analysis begins by focusing only on traditional, in-person public schools, meaning we do not include charter schools, private schools, online schools, or intermediate districts, though we do return to non-participation in these other settings later in the brief. Table 1 shows the traditional public schools in Minnesota with the highest grade-level non-participation rates, breaking this rate down into its two sources: refusal to take the test and inability to take the test due to absence.⁵
Table 1. Top 25 Grade-Level Non-Participation Rates – Public School Reading, 2024-25
Traditional public schools only; school-grade combinations with fewer than 10 eligible students excluded. Source: MDE MCA/MTAS public reporting files, 2024-25.
Table 1 shows just how high non-participation rates are for certain schools, reaching nearly 60% of 10th grade students in Farmington. Most of the other high rates also appear among 10th graders too, though Menahga schools reveal high non-participation for earlier grades too, including 42% in their 6th grade elementary school. In addition, Table 1 demonstrates that while non-participation does cluster in certain areas (e.g., Menahga), this issue is not isolated to one part of the state or one kind of school. The results indicate high non-participation rates in large and small schools, as well as urban schools in Minneapolis and St. Paul, and suburban and rural schools alike.
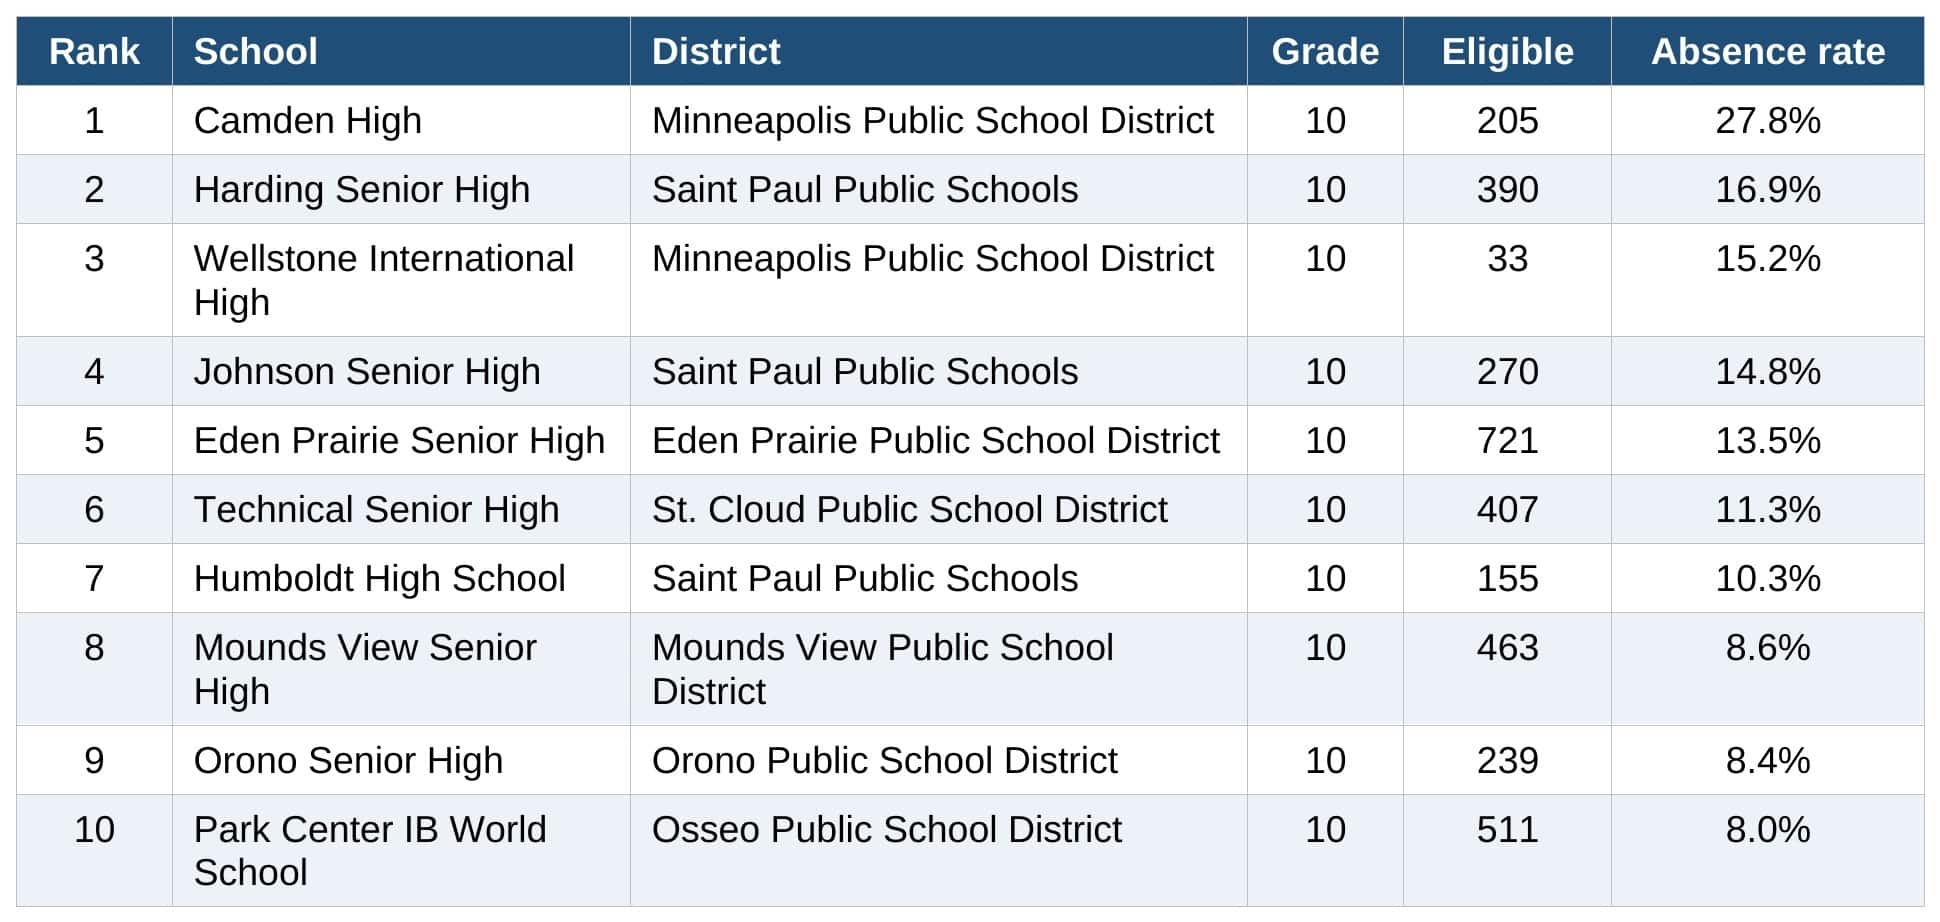
With that said, the results do point to some patterning in relation to geography. In general, the highest non-participation rates tend to be driven by refusals, but in some cases, absences play a bigger role. The results in Table 1 suggest absences show up more in urban schools in Minneapolis and St. Paul. To dig into this distinction further, Table 2 shows the schools with the ten highest grade-level absence rates in the state.
Table 2. Top 10 Grade-Level Absence Rates – Public School Reading, 2024-25
Traditional public schools only; school-grade combinations with fewer than 10 eligible students excluded. Source: MDE MCA/MTAS public reporting files, 2024-25.
This table confirms that absences are a bigger issue in urban schools, though schools in places like Orono, St. Cloud, and Eden Prairie demonstrate it is not strictly happening in the Twin Cities urban core. That we see this patterning in refusal and absence rates suggests that more analysis should be done to dig into what is driving non-participation, rather than assuming the same factors work across schools and geographies.
Before closing this discussion of absences, it is important to point out that these results come from 2024-25 testing, meaning they pre-date Operation Metro Surge, the federal immigration enforcement operation that began in December 2025 and increased substantially in January 2026. Reporting on the operation’s effects on schools has been stark, with indications that some districts saw up to 60% absenteeism, with one superintendent reporting 1,200 absences in a single day.⁶ Given these disruptions, we would expect non-participation based on absences to be worse in the 2026 MCA data.
Not Just High School Kids
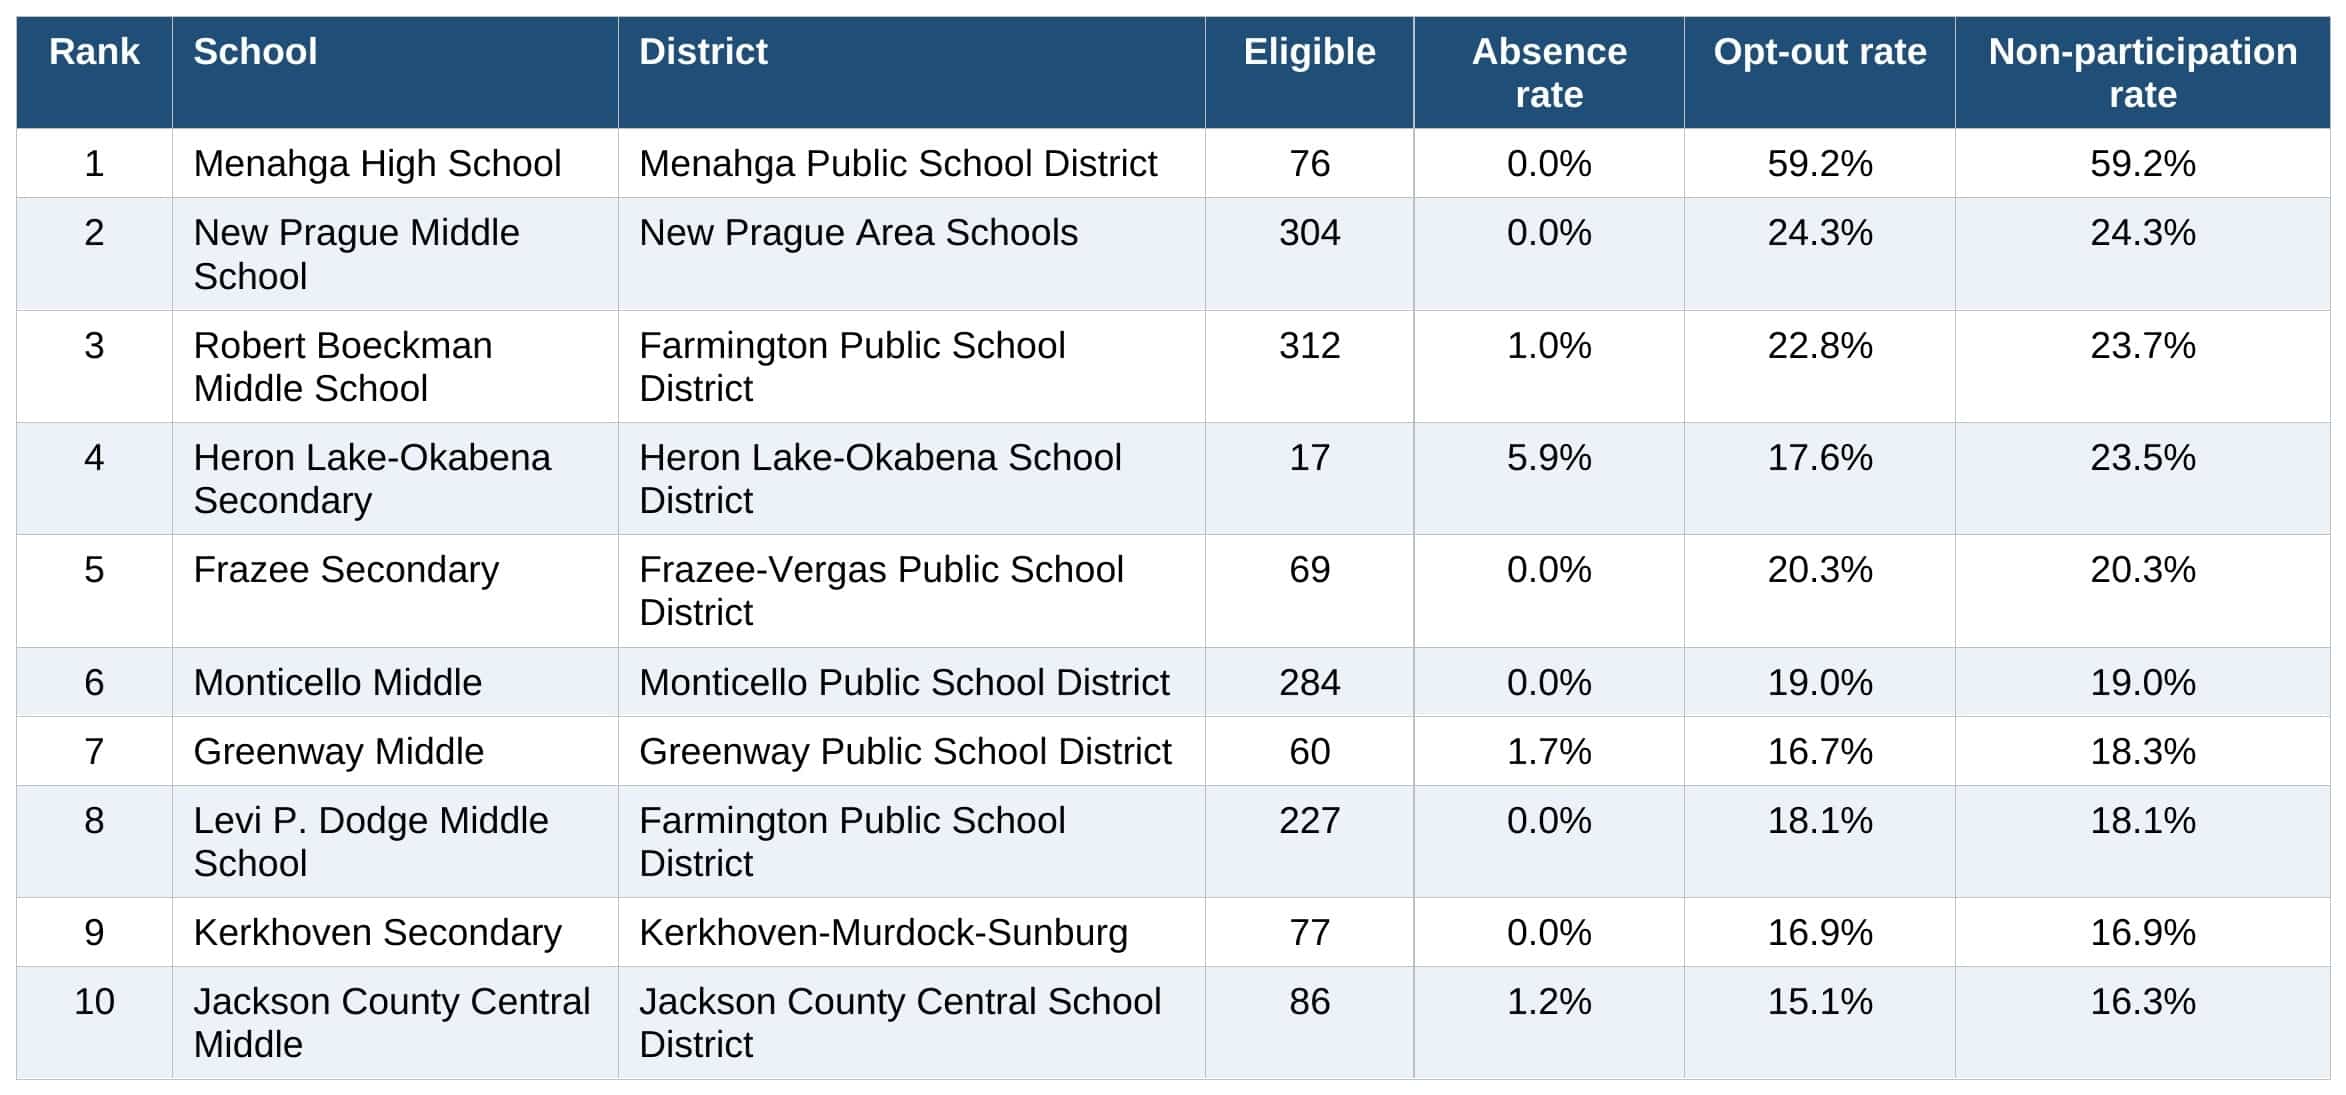
Table 1 shows that most of the largest non-participation rates occur in high school during the 10th grade reading test. With that said, additional analysis indicates that non-participation starts earlier. In focusing only on eighth grade reading tests, Table 3 reveals that several schools see high levels of non-participation at this earlier age.
Table 3. Top 10 Grade 8 Non-Participation Rates – Public School Reading, 2024-25
Restricted to Grade 8 reading school-grade combinations with at least 10 eligible students. Source: MDE MCA/MTAS public reporting files, 2024-25.
In addition to demonstrating the scale of opt-outs in the eighth grade, Table 3 also finds that non-participation at this age shows up across geographic areas, though more of the schools on this list are in rural districts.
Reaching a New Level
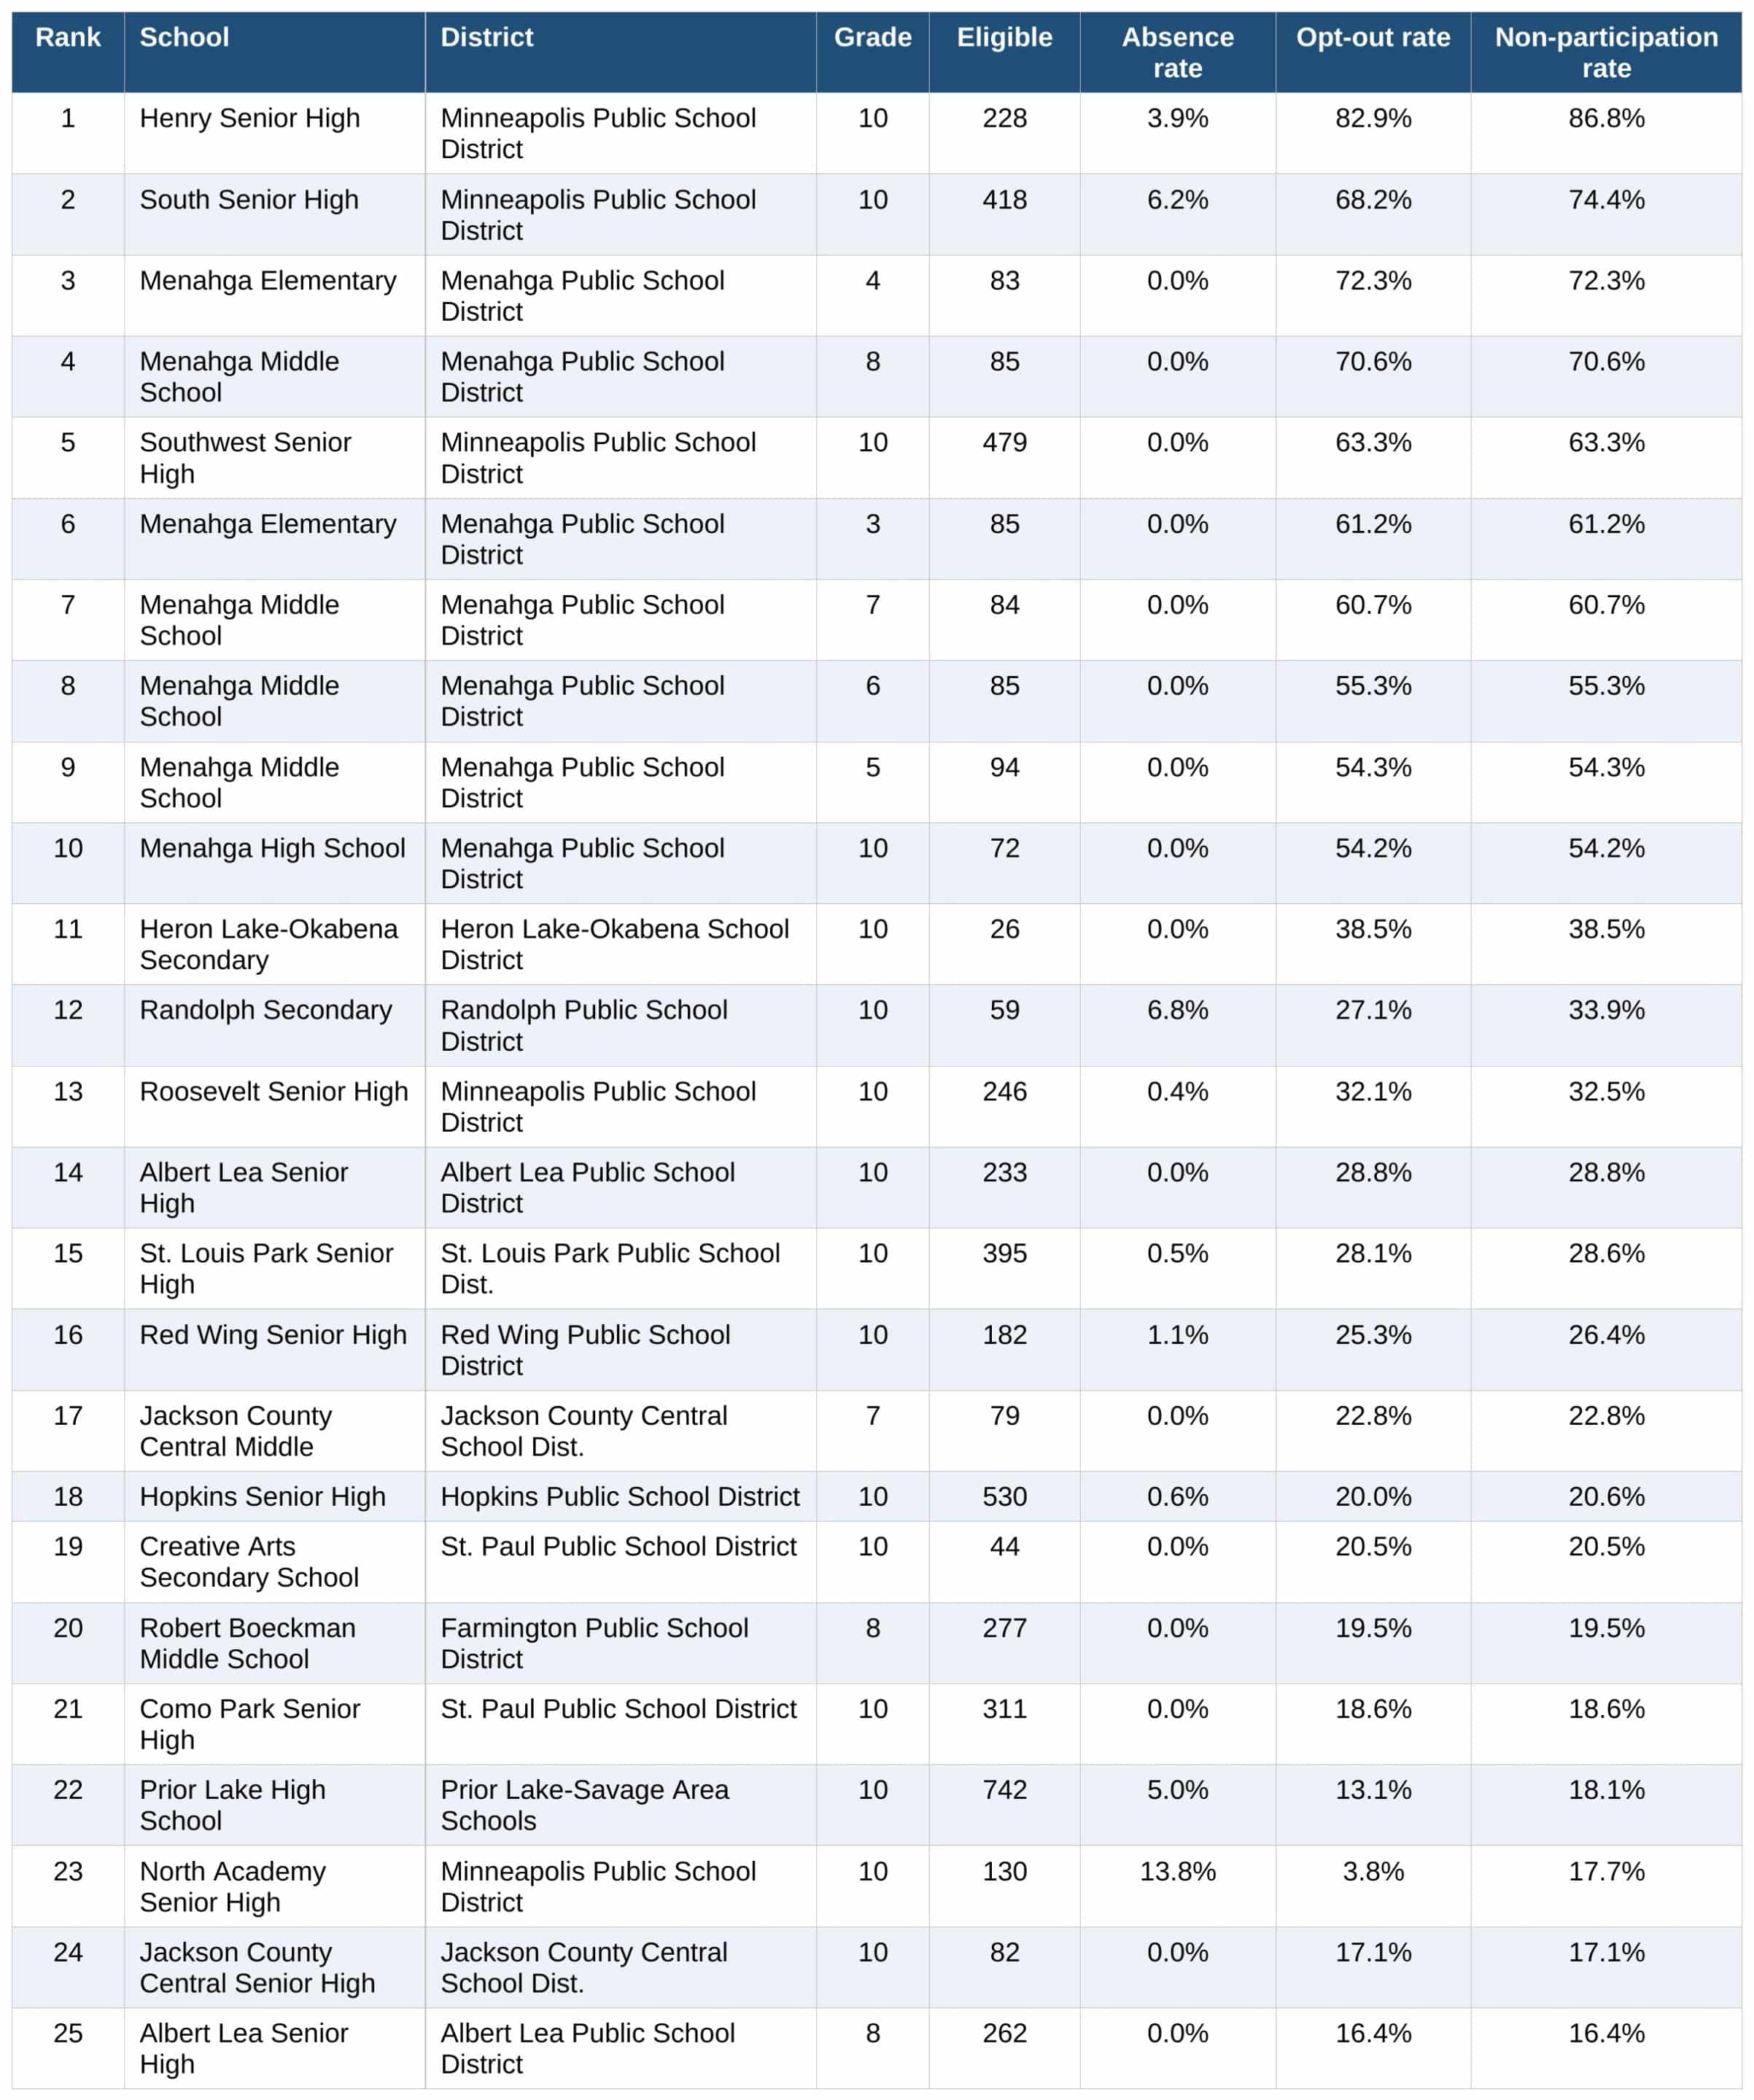
Much has been made of the impact the pandemic had on the education system, so it’s worth investigating how non-participation rates have changed in recent years and if they were as widespread prior to COVID lockdowns. To assess this question, we analyze data from 2018-19 testing. Looking at the top 25 schools, we see that this issue was prevalent before the pandemic.
Table 4. Top 25 Grade-Level Non-Participation Rates – Public School Reading, 2018-19
Traditional public schools only; school-grade combinations with fewer than 10 eligible students excluded. Source: MDE MCA/MTAS public reporting files, 2018-19.
This analysis reveals that non-participation rates were even higher at many schools in 2019, including more than 86% at Minneapolis’s Henry Senior High. Notably, the specific schools driving non-participation have mostly changed between 2019 and 2025, but the underlying rates have stayed high throughout, suggesting non-participation itself hasn’t gone away, even as the schools in which it concentrates have shifted.
While Table 4 indicates high rates of non-participation in 2019, we also dug further into the data to examine changes over time. To do so, we investigated the share of schools where more than 5% of students did not participate in the test. This threshold is meaningful, as it highlights the schools that did not meet the federal standard of 95% participation. Viewed through this lens, we do see an indication of non-participation getting worse.
Figure 1. Share of Tests Below the 95% Participation Threshold by Grade – Public School Reading, 2019 and 2025
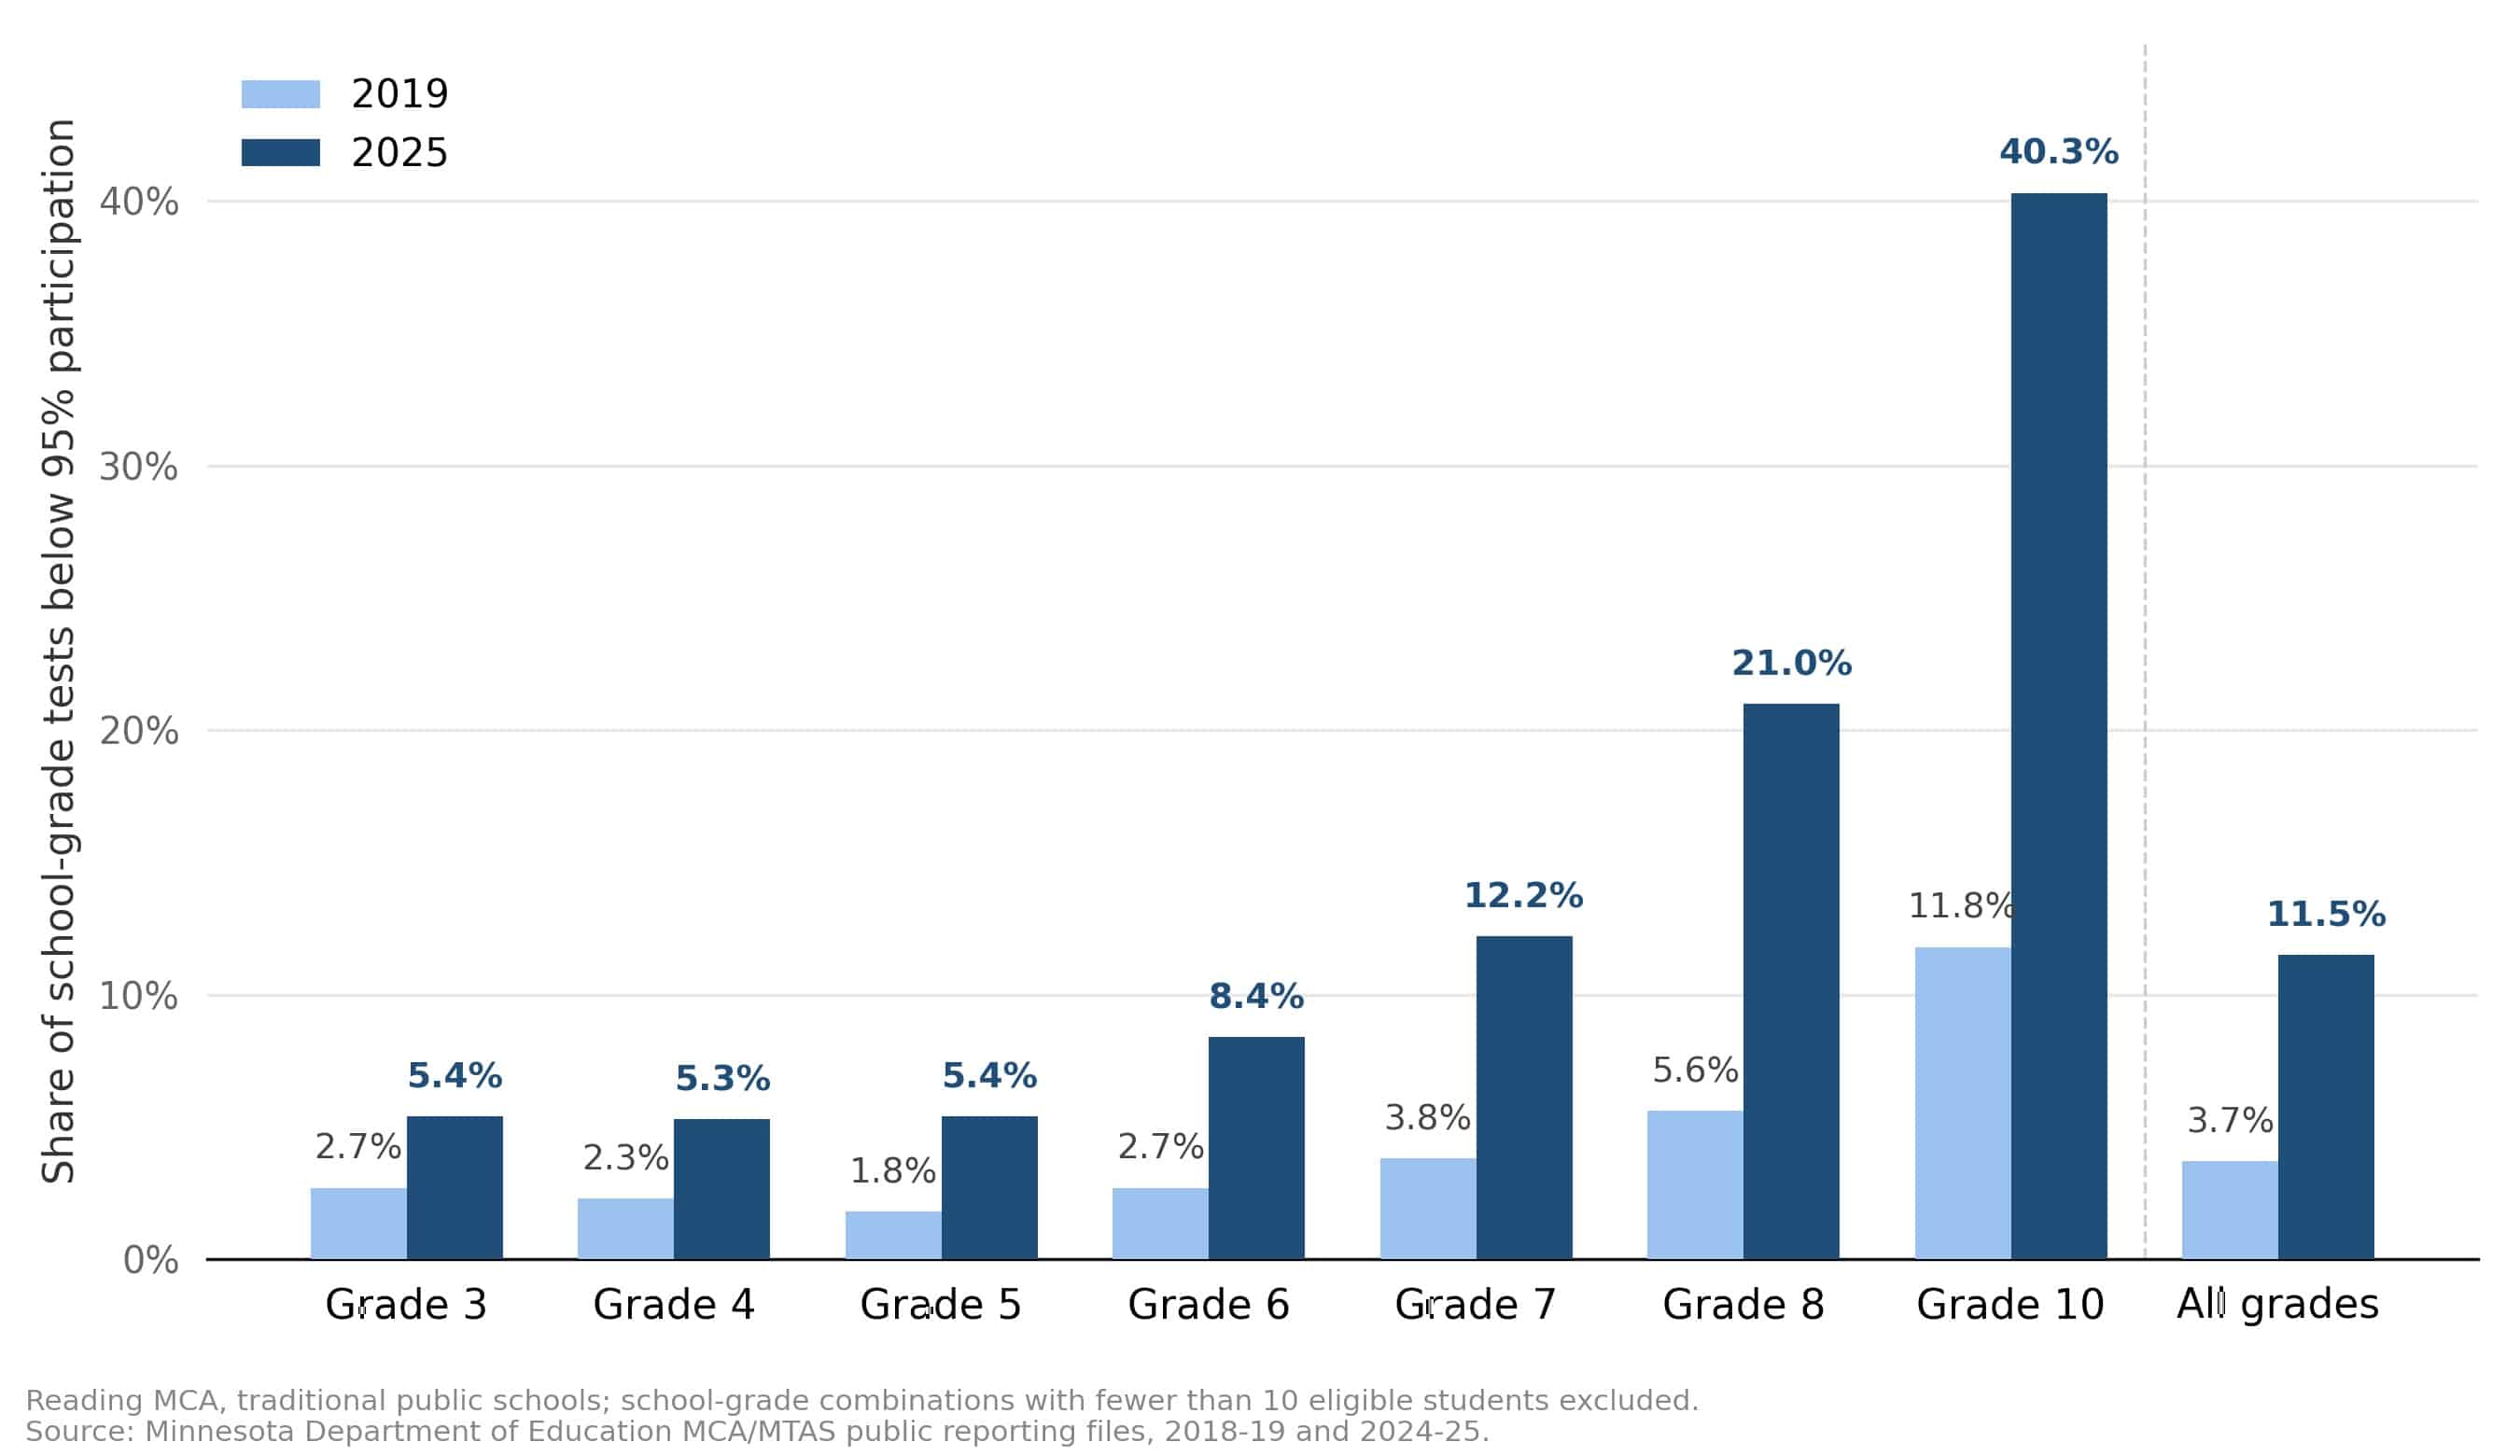
In 2019, across all grades and schools, fewer than 4% of grade/school combinations did not meet the 95% threshold. By 2025, that rate had more than tripled to 11.5%. Moreover, Figure 1 shows that non-participation has gotten larger at every grade level. Where less than 12% of 10th grade tests failed to meet this threshold in 2019, it was over 40% of all 10th-grade tests in 2025. Further analysis reveals that this jump comes from both increased absences and refusals, with both average absence and opt-out rates roughly doubling between 2019 and 2025.
District-Level Analysis
Up to this point, our analysis has been focused at the school level. To provide a more comprehensive assessment, we also investigate how non-participation functions not just in specific schools but across full districts.
Table 5. Top 10 Grade-Level Non-Participation Rates – District-Level Public School Reading, 2024-25
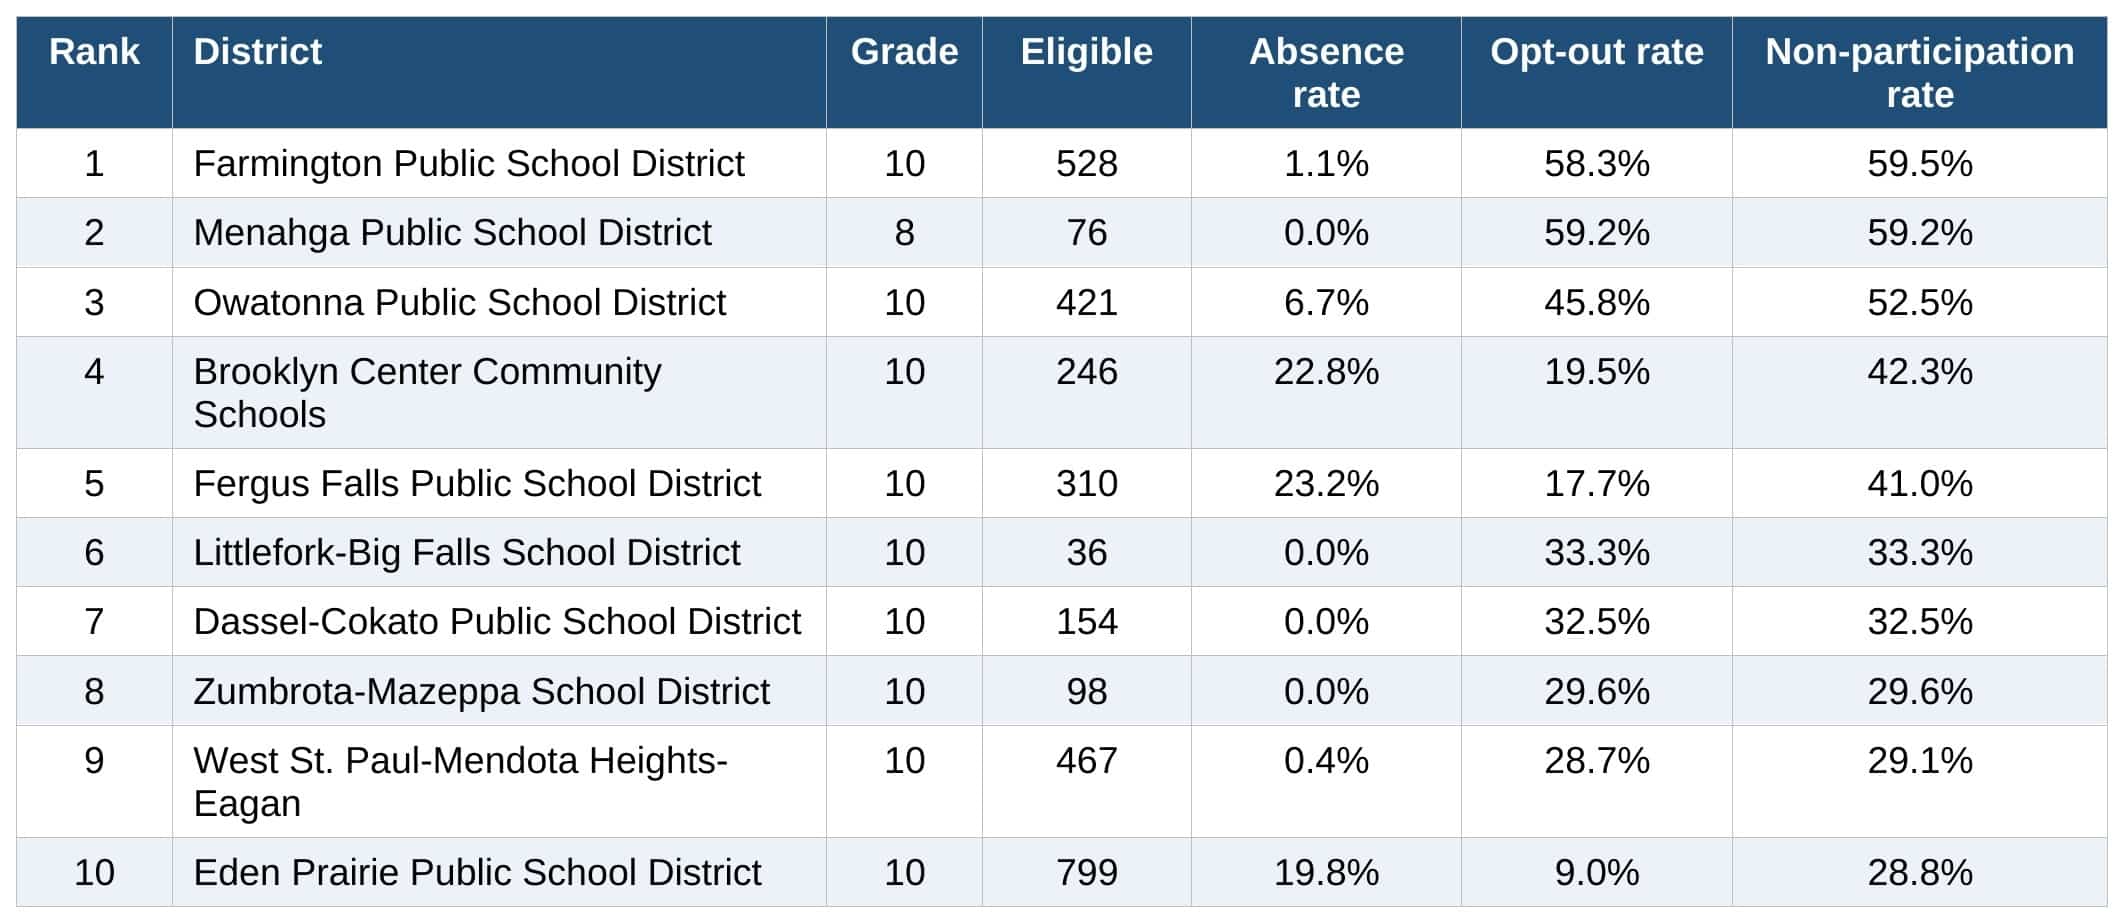
District-level totals, traditional public districts only. To avoid repetition, each district appears only once, at its highest-ranking grade. As a result, Menanhga is not included more than once despite multiple grades showing up among the highest district-level rates. Source: MDE MCA/MTAS public reporting files, 2024-25.
In many of these cases, the names will look familiar because the district contains only one school, such that the school- and district-level rates are identical (e.g., Menahga). But we also see some new names show up when the focus is placed on the district, including Littlefork-Big Falls, Dassel-Cokato, and West St. Paul-Mendota Heights-Eagan, again showcasing a mix of rural and suburban districts.
Notably, the urban school districts of Minneapolis and St. Paul fall off this list. While both contain grade 10 opt-out rates over 20%, they do not crack the top ten. Of note, these results mirror earlier ones in showing that some districts see non-participation rates driven by refusals, while others are driven more by absences.
Variation by School Type
Our final analysis moves us beyond traditional public schools. In this section, we examine non-participation rates in other school types as well, including schools focusing on special education, charter schools, alternative learning centers (ALCs), and intermediate school districts.⁷ Replicating our previous approach, we examine these additional venues by uncovering the share of grade-level tests in which they failed to meet the federal standard of 95% participation.
Figure 2. Share of School-Grade Reading Tests Below the 95% Participation Threshold, by School/District Type – 2024-2025
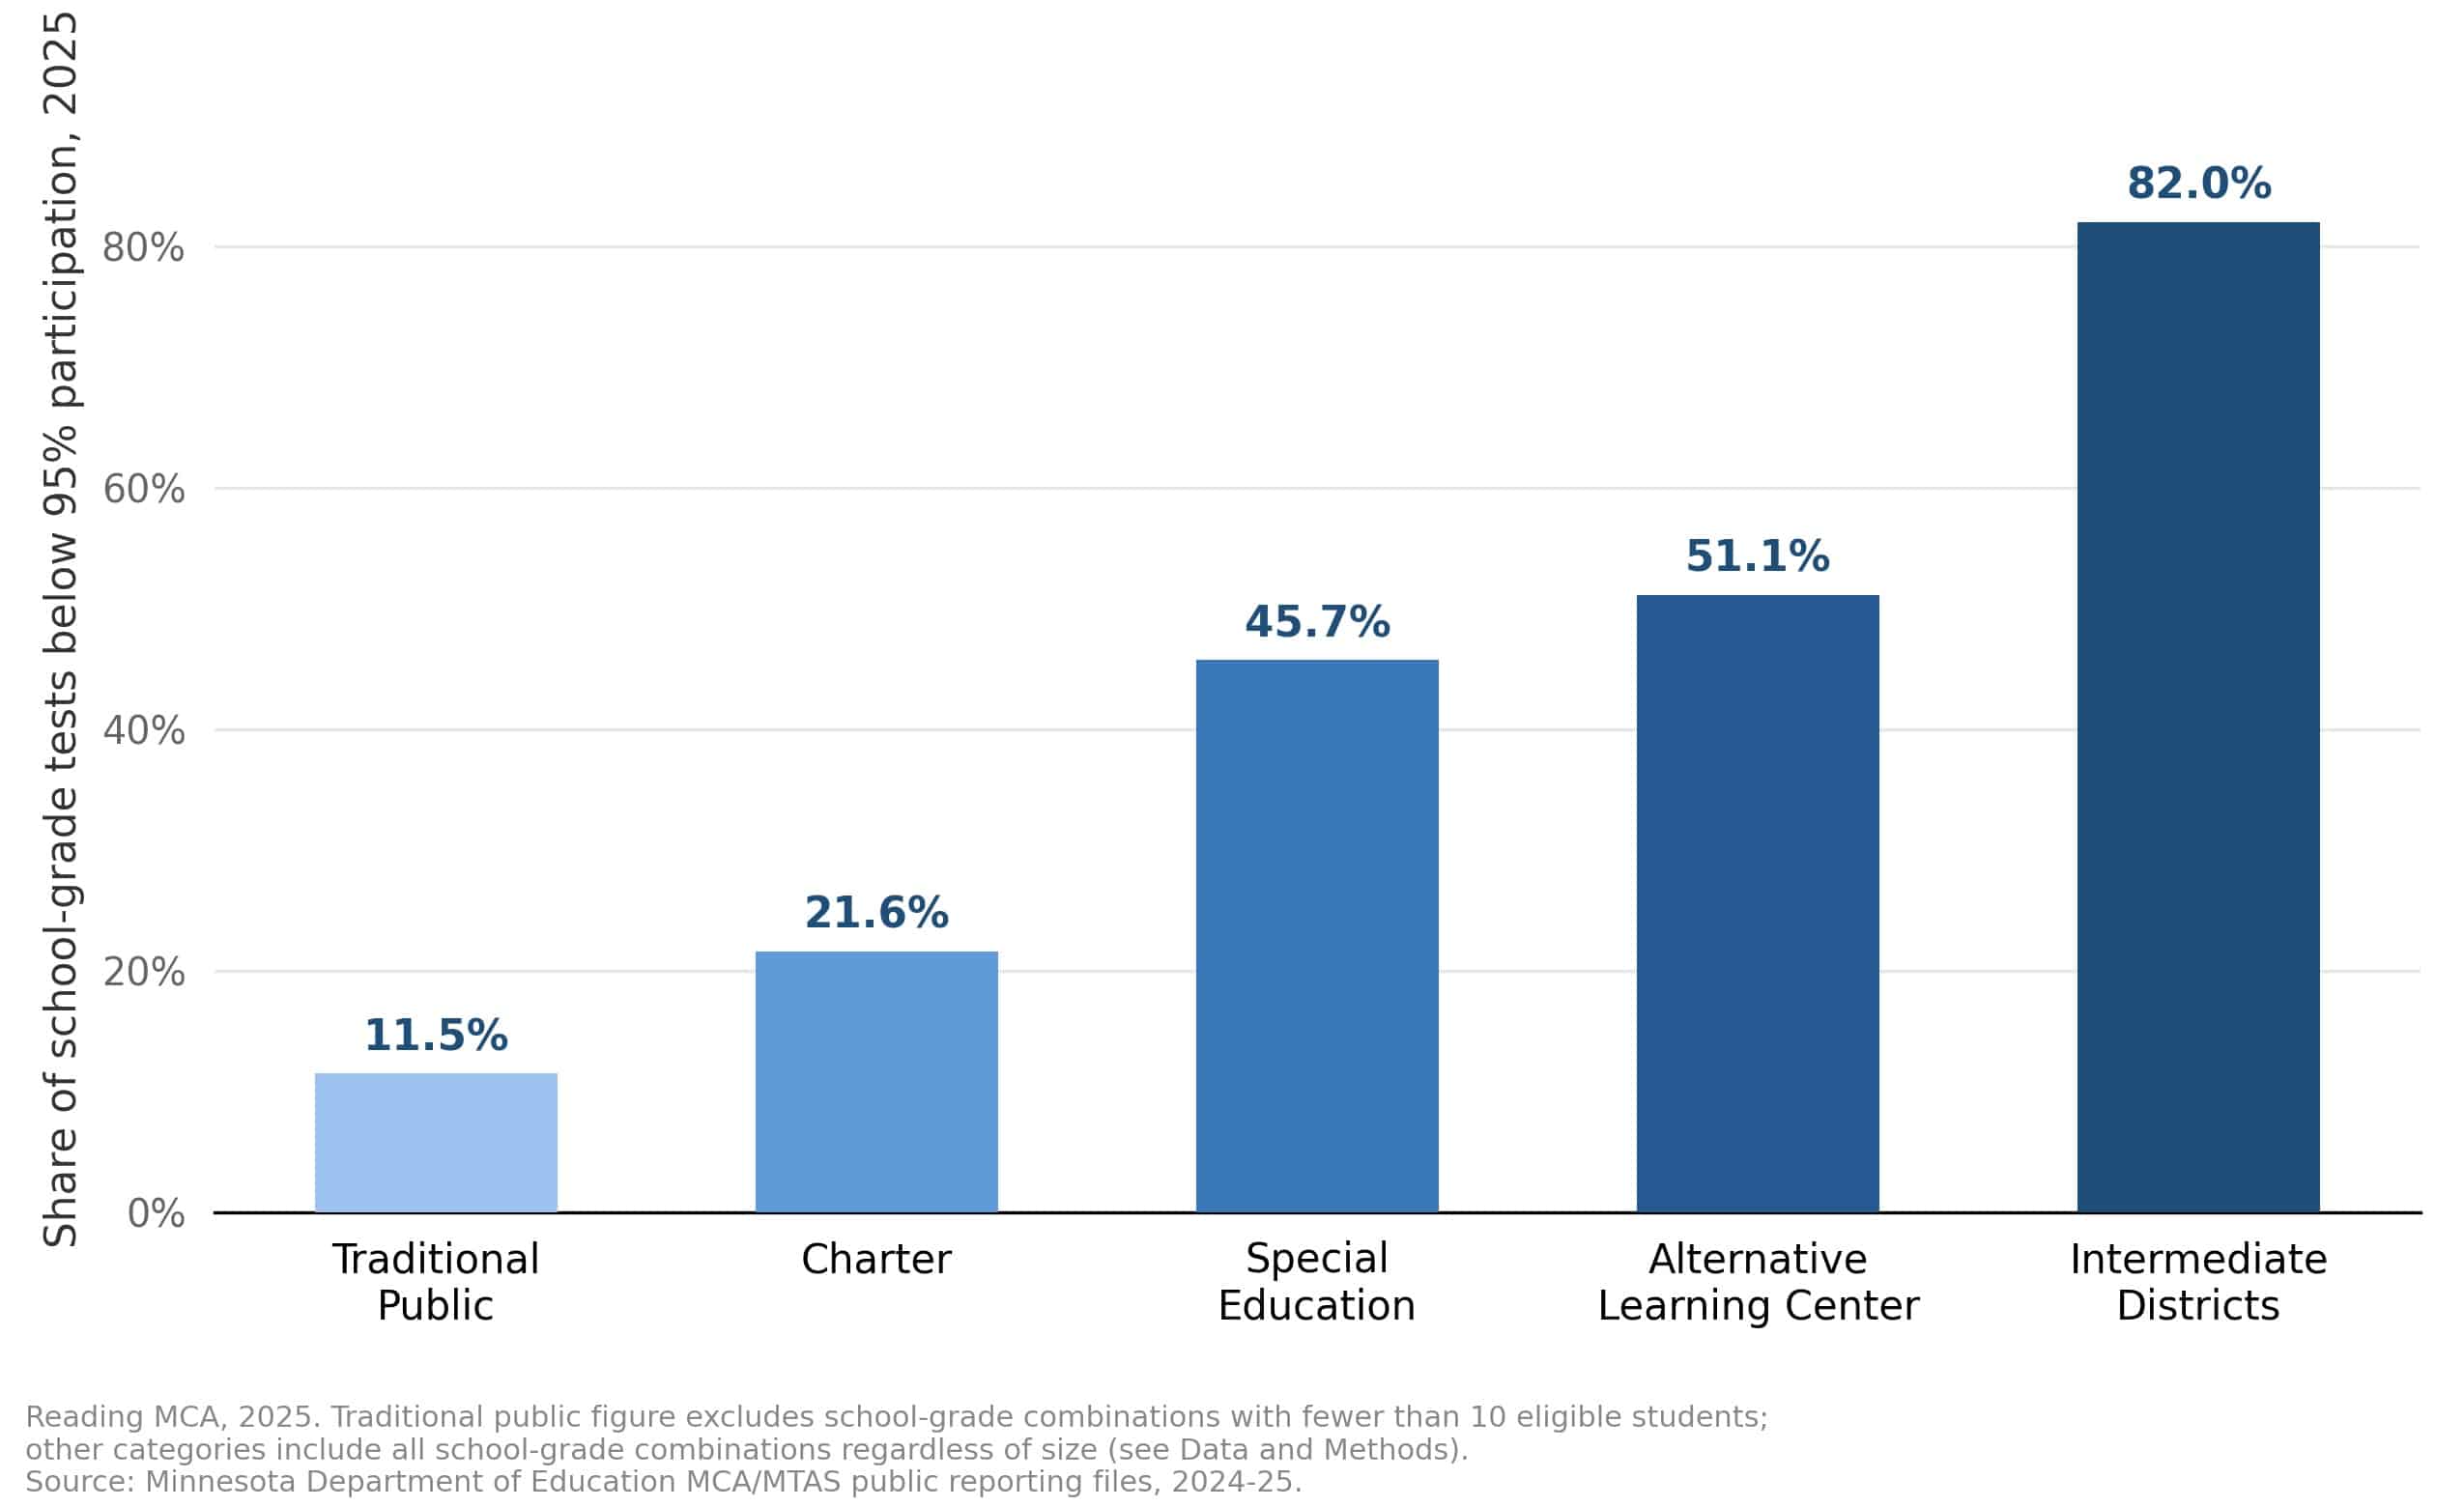
Far from being an issue that is isolated to traditional public schools, Figure 2 shows that non-participation is substantially more pronounced in other types of schools and districts. Where roughly one-in-nine school-grade combinations fail to meet the 95% threshold in traditional public schools, this rate jumps to two-in-ten in charters, one-in-two special education schools and ALCs, and more than eight-in-ten intermediate districts.
Conclusion
While it is fair to ask for an evaluation of how schools are performing, it is equally important to ensure that we are analyzing any evaluation criteria we are using. Absent such an investigation, we are prone to misleading understandings of how students are performing. This research brief focuses on this question through the lens of non-participation rates on MCA tests. We find reasons to be concerned, including high rates of non-participation at schools throughout the state, as well as evidence that an increasing number of schools are failing to meet the federal standard for participation. Given these results, we believe that policymakers and parents should, at a minimum, ask questions about what the test is measuring before drawing conclusions from any results.
Appendix
Math Test Results
This appendix presents the same tables and figures shown for reading in the body of the report, but for MCA math tests. As noted above, the results are relatively similar to those reported for reading, though non-participation rates tend to be slightly higher for math tests.
Appendix Table 1. Top 25 Grade-Level Non-Participation Rates – Public School Math, 2024-25
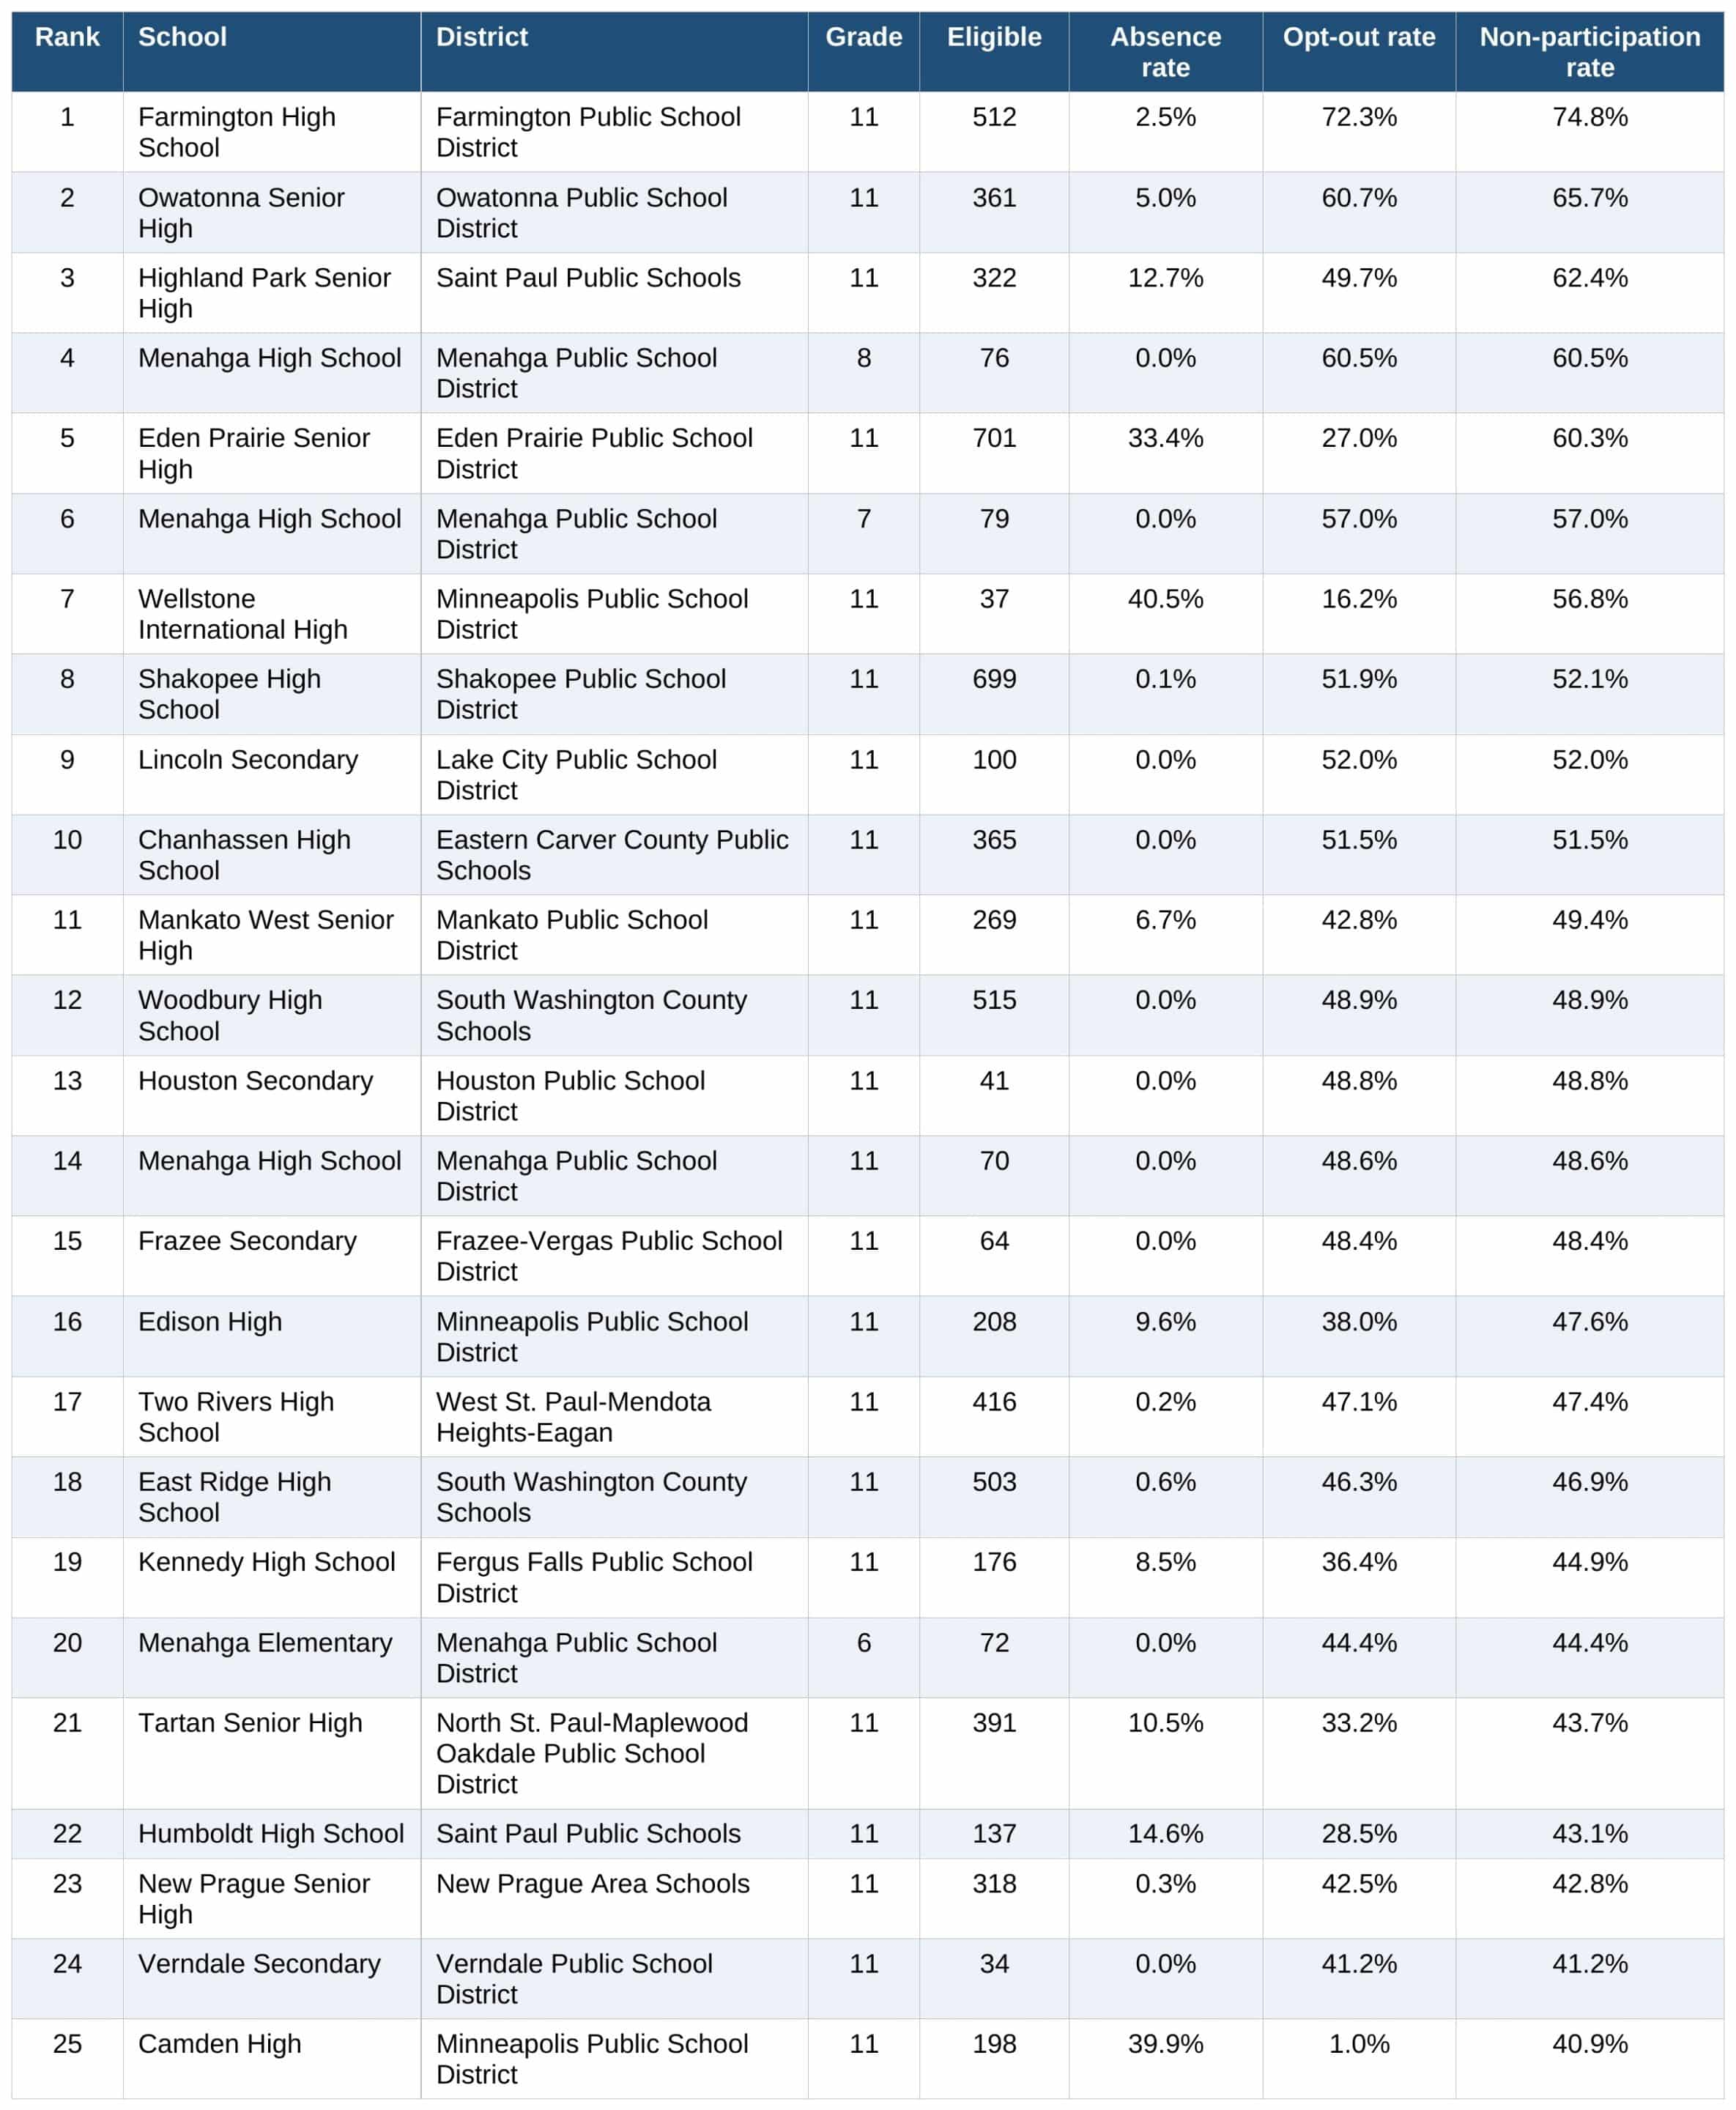
Traditional public schools only; school-grade combinations with fewer than 10 eligible students excluded. Source: MDE MCA/MTAS public reporting files, 2024-25.
Appendix Table 2. Top 10 Grade-Level Absence Rates – Public School Math, 2024-25
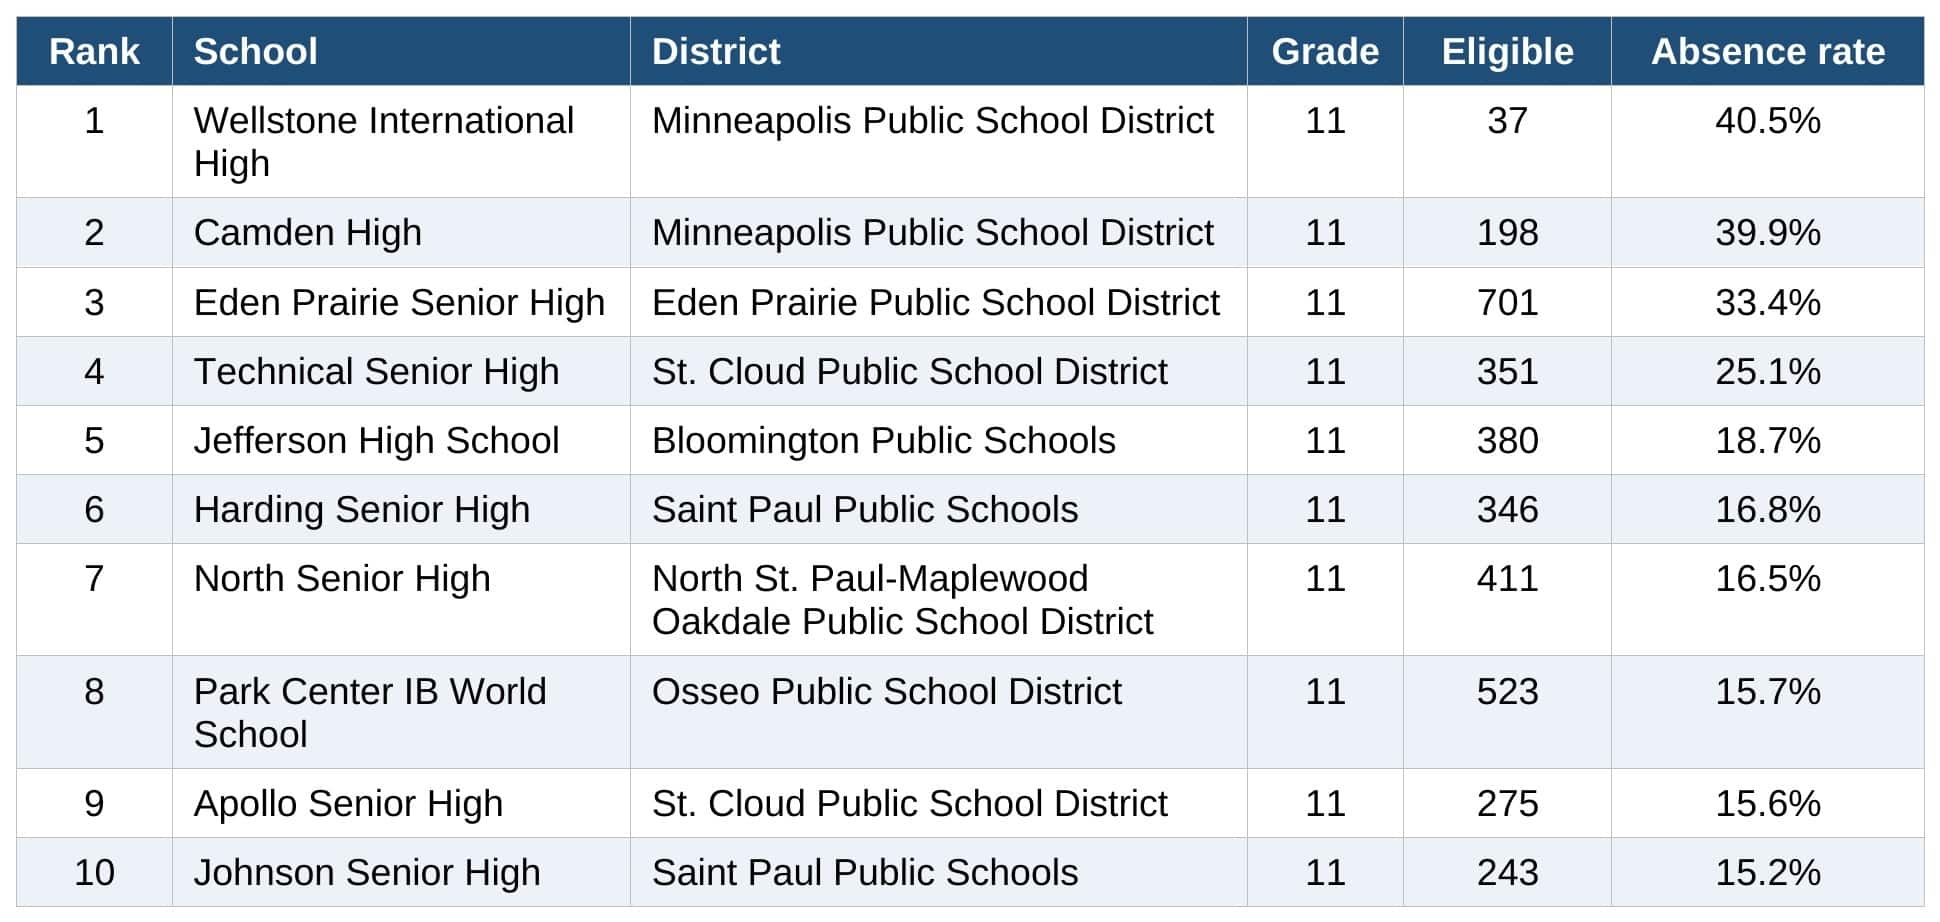
Traditional public schools only; school-grade combinations with fewer than 10 eligible students excluded. Source: MDE MCA/MTAS public reporting files, 2024-25.
Appendix Table 3. Top 10 Grade 8 Non-Participation Rates – Public School Math, 2024-25
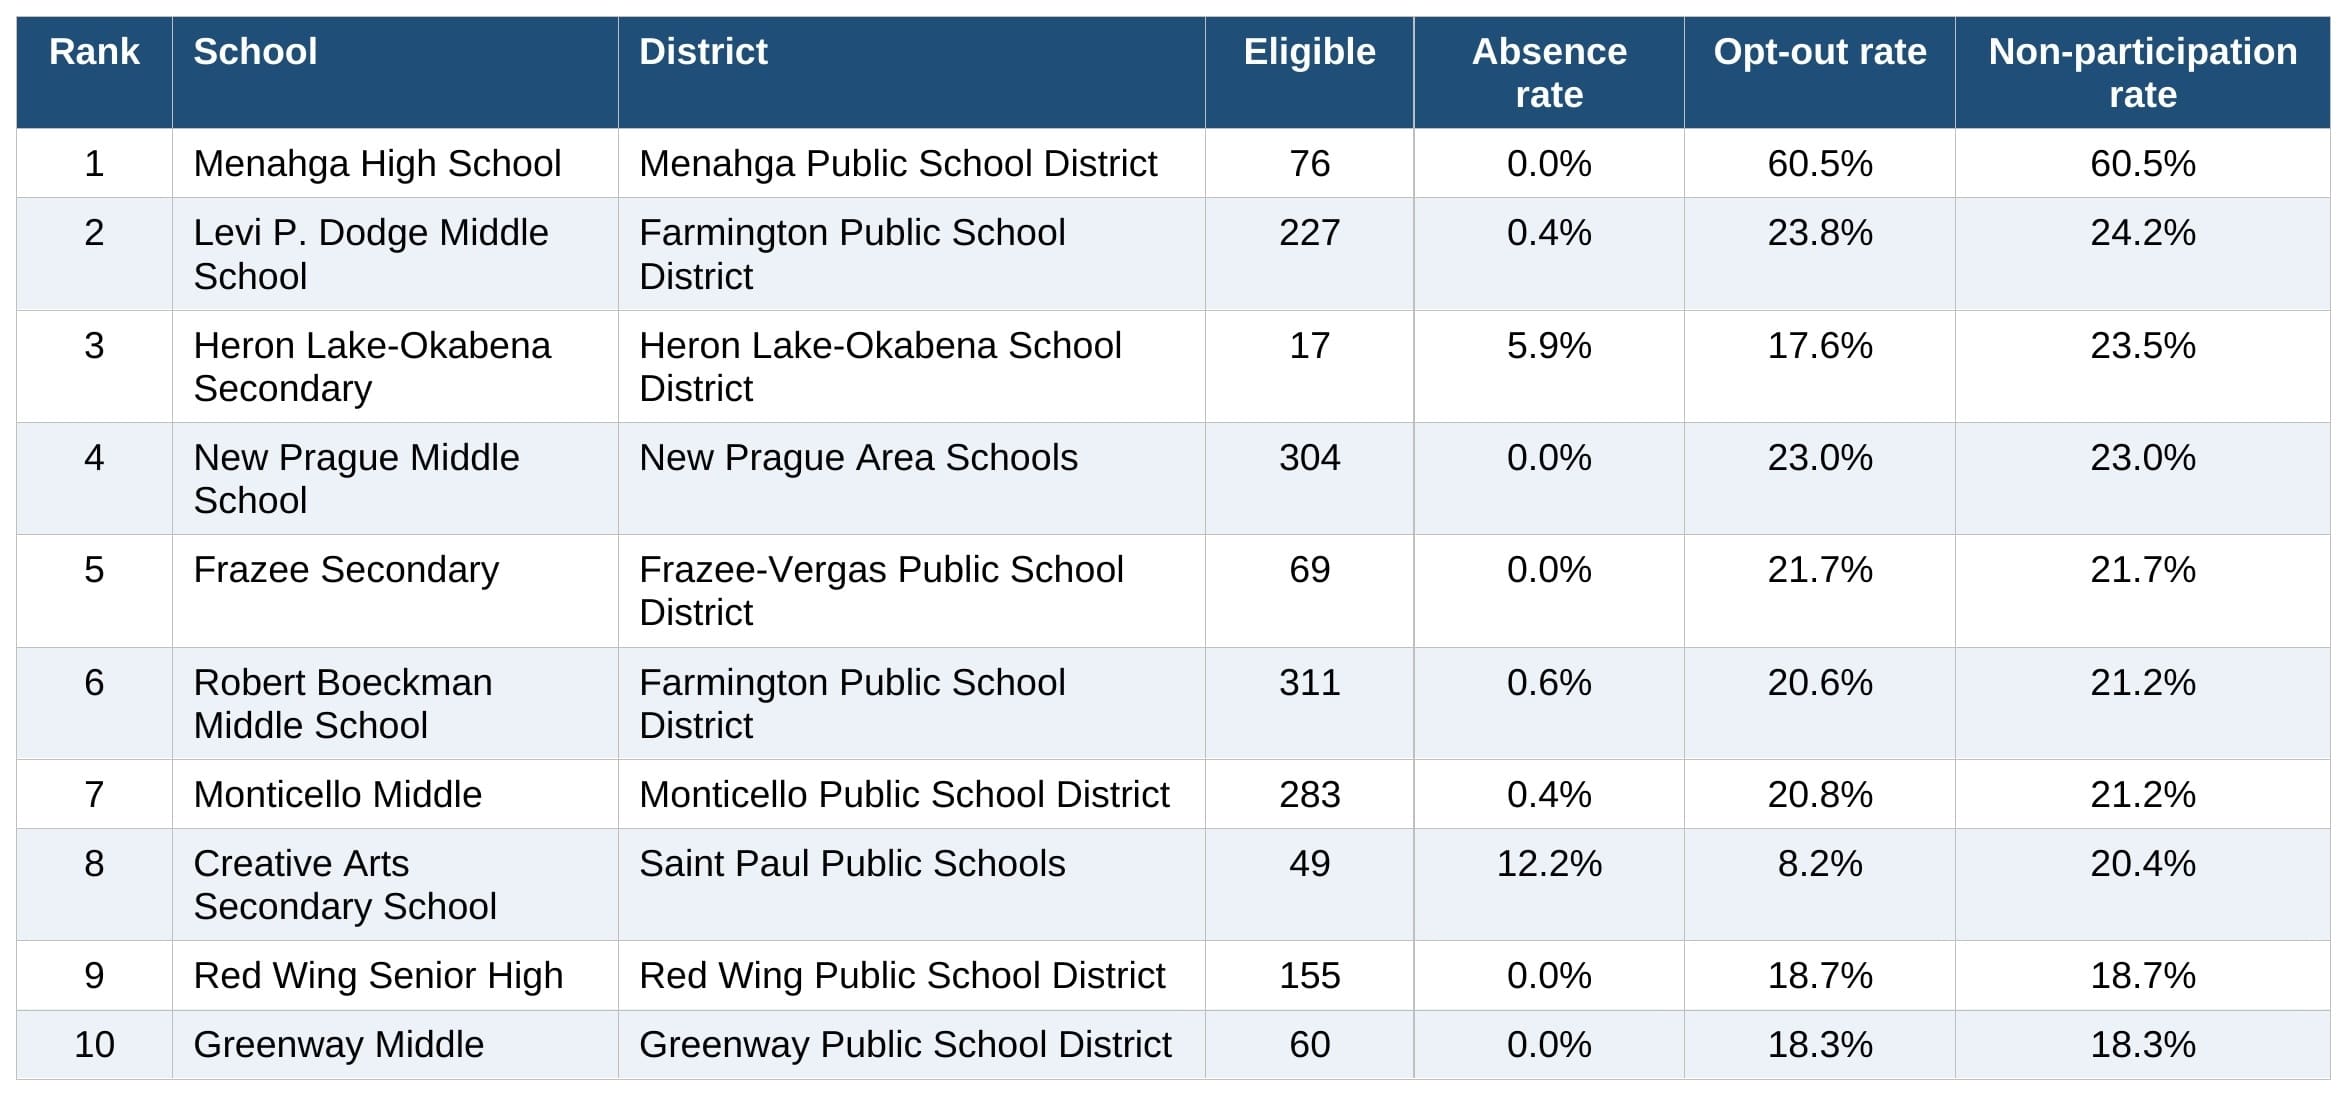
Restricted to Grade 8 math school-grade combinations with at least 10 eligible students. Source: MDE MCA/MTAS public reporting files, 2024-25.
Appendix Table 4. Top 25 Grade-Level Non-Participation Rates – Public School Math, 2018-19
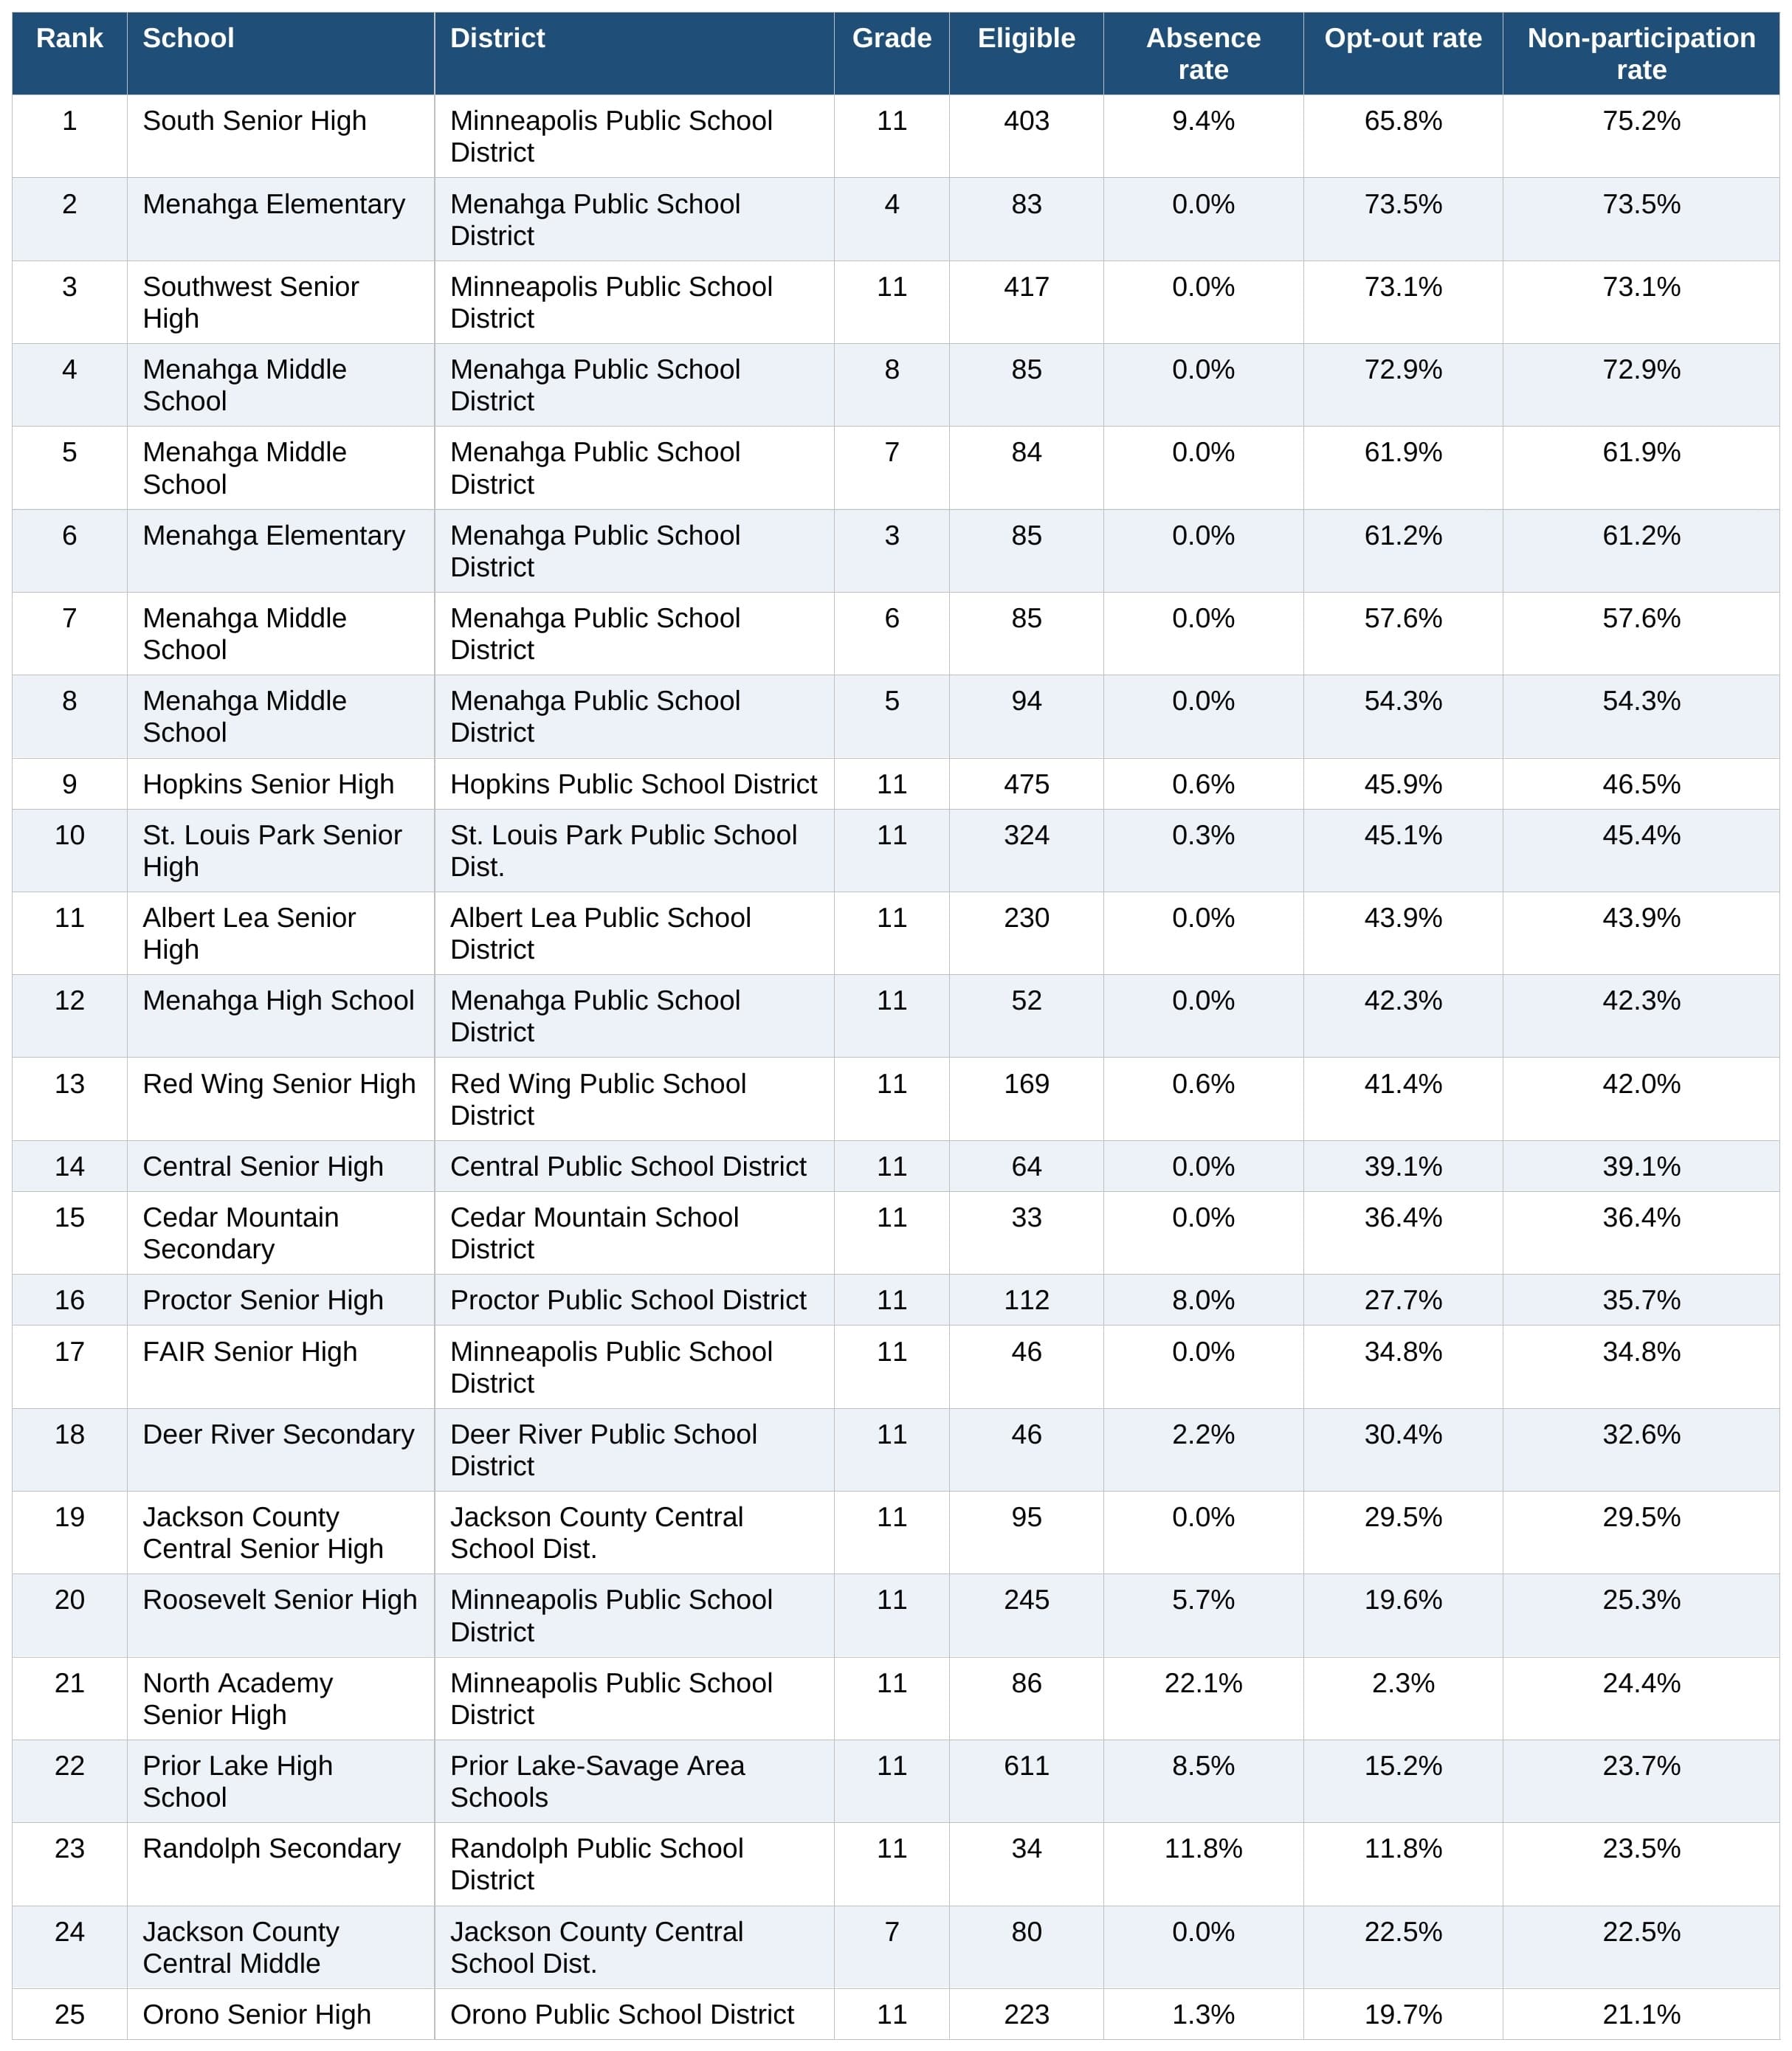
Traditional public schools only; school-grade combinations with fewer than 10 eligible students excluded. Source: MDE MCA/MTAS public reporting files, 2018-19.
Appendix Figure 1. Share of Tests Below the 95% Participation Threshold by Grade – Public School Math, 2019 and 2025
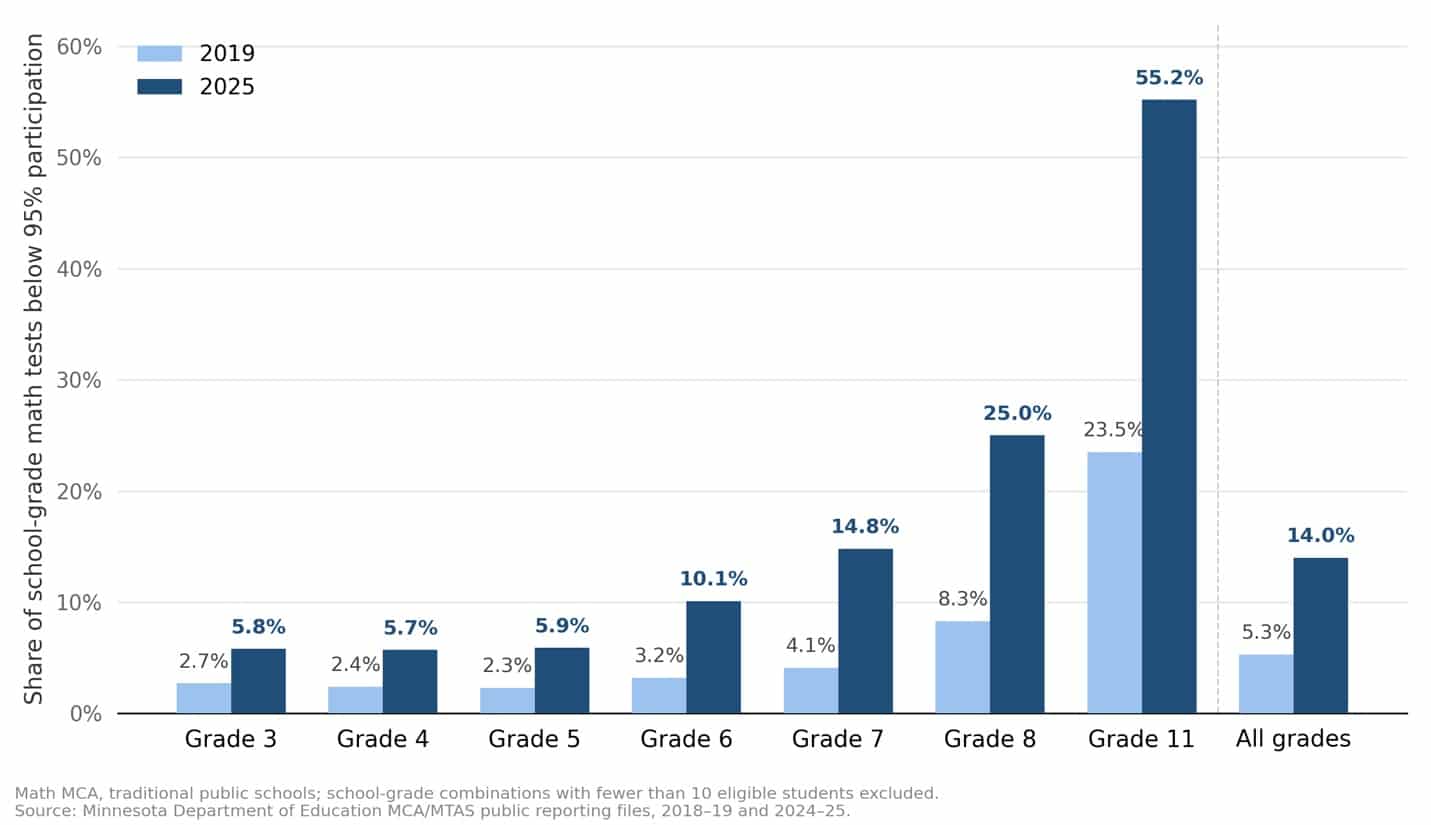
Appendix Table 5. Top 10 Grade-Level Non-Participation Rates – District-Level Public School Math, 2024-25
 District-level totals, traditional public districts only. Each district appears only once, at its highest-ranking grade. Source: MDE MCA/MTAS public reporting files, 2024-25.
Appendix Figure 2. Share of School-Grade Math Tests Below the 95% Participation Threshold, by School/District Type – 2024-2025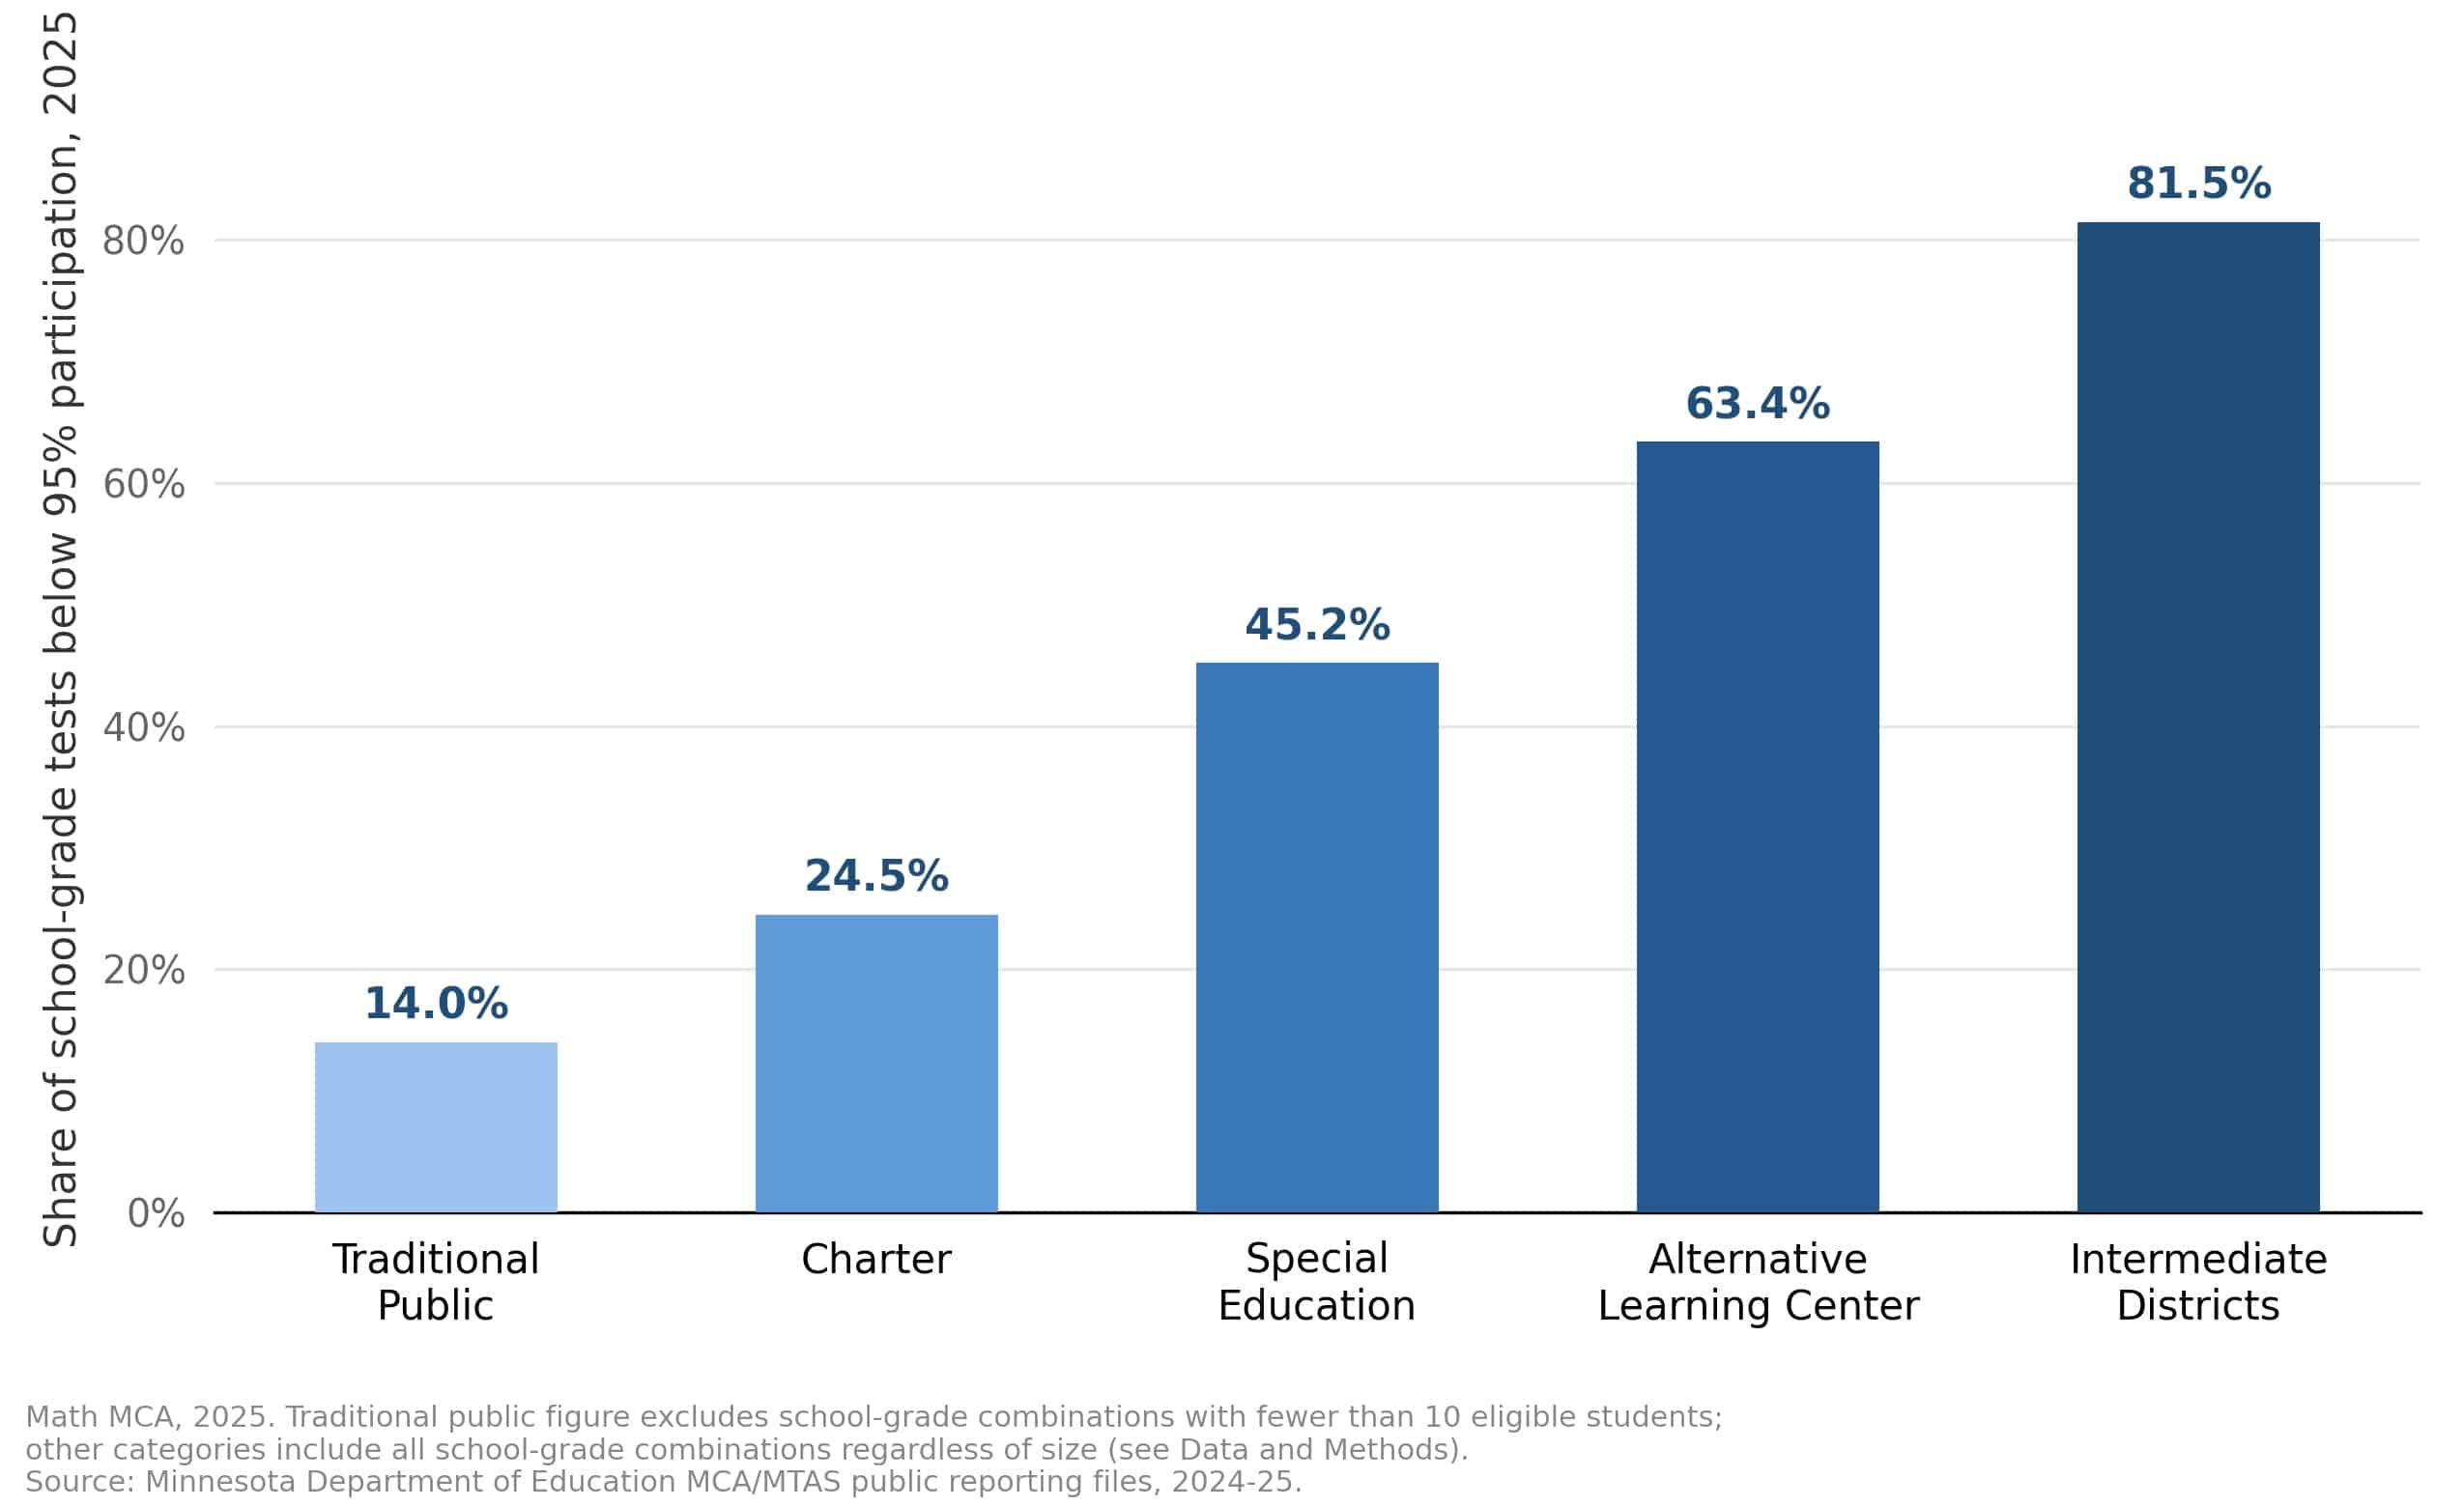
Data and Methods
The analysis included in this research brief uses the Minnesota Department of Education’s (MDE) public MCA/MTAS reporting files for the 2018-19 and 2024-25 school years, for both the Math and Reading MCAs. Data can be found at pub.education.mn.gov/MDEAnalytics/DataTopic.jsp?TOPICID=1.
For the primary analysis (Tables 1-5 and Figure 1), we limit the analysis to traditional, in-person public schools: District Type 1 (regular independent school districts) and District Type 3 (special school districts), and School Classification codes 10 (elementary), 20 (middle), 31 (junior high), 32 (senior high), and 33 (secondary). This excludes charter schools, intermediate districts, online programs, alternative learning centers, and other non-traditional settings. All figures reflect the “All Students” total for a school and grade, not demographic subgroups.
As Minnesota tests reading and math in grades 3 through 8, plus reading in grade 10 and math in grade 11, we treat each school-grade combination as its own observation rather than combining multiple grades within a school into a single rate.
For each school-grade combination, we calculate:
- Eligible students: the number of students scheduled to take the test. This counts the sum of students with valid scores, absences, invalid tests, medical exemptions, incomplete or not-attempted tests, refusals, and wrong-grade administrations. We exclude students marked “not enrolled,” since they were not actually part of the school’s tested population that year.
- Absence rate: students marked absent, divided by the number of eligible students.
- Refusal rate: students where either the parent or the student refused the test, divided by the number of eligible students.
- Non-participation rate: absences plus refusals, divided by the number of eligible students.
Rankings are limited to school-grade combinations with at least 10 eligible students, consistent with MDE’s own practice of flagging groups under 10 students.
For Figure 1, “share of schools not meeting the 95% threshold” is calculated by treating each individual school-grade non-participation rate as a separate observation and computing the share of those observations above 5%.
For Figure 2, we group school-grade combinations into five categories: Traditional Public (as defined above), Charter (District Type 7), Special Education (School Classification 50), Alternative Learning Center (School Classification 41, 42, or 43), and Intermediate Districts (District Type 6). We did not apply a precedence rule across these categories, so some school-grade combinations fall into more than one non-traditional category. For example, a charter school focused on special education is counted as both a charter school and a special education school. Unlike the Traditional Public category, the four non-traditional categories are not restricted to school-grade combinations with at least 10 eligible students, since that threshold would have excluded a large share of the data in these smaller settings, though it is worth noting that applying the same 10-student threshold to these categories produces substantively similar results.
Endnotes:
- “Federal Education Policy 101: State Assessments,” Bipartisan Policy Center, December 2025, https://bipartisanpolicy.org/explainer/federal-education-policy-101-state-assessments/.
- See Minn. Stat. § 120B.31, subd. 4a. The statute requires the state to create a refusal form and requires districts to notify parents of their right to decline testing on their child’s behalf: https://www.revisor.mn.gov/statutes/cite/120b.31.
- “Standardized Student Testing,” Office of the Legislative Auditor, March 2017, https://www.leg.mn.gov/docs/2017/other/170481.pdf.
- Testing data can be found in the “Assessment Files” section of MDE’s Data Reports and Analytics website. See https://pub.education.mn.gov/MDEAnalytics/DataTopic.jsp?TOPICID=1.
- The original results break the refusal statistic into two categories: student refusal and parent refusal. In this analysis, we combine those categories together to create a comprehensive refusal rate.
- For estimate of 60% absenteeism, see Lani Ngonethong, Muhammad Memon, Maheideri Belay, and Ola Osibodu, “How Operation Metro Surge affected students’ lives amid ICE raids in Minnesota,” Sahan Journal, March 19, 2026, https://sahanjournal.com/news-partners/operation-metro-surge-impact-minnesota-students/. For estimate of 1,200 absences in one day, see Graham Johnson, “Educators detail impact of Operation Metro Surge on students, schools,” Minnesota House of Representatives, February 19, 2026, https://www.house.mn.gov/sessiondaily/Story/18881.
- Intermediate districts are cooperative arrangements through which several member districts jointly fund specialized programs, often in special education. Alternative Learning Centers generally serve students who have been identified as at risk of educational failure.