By, Aaron Rosenthal, Research Director, North Star Policy Action and Aaron Sojourner, Senior Economist and Deputy Director of Research, W.E. Upjohn Institute
Since the U.S. Department of Homeland Security (DHS) launched Operation Metro Surge, many business owners, workers, educators, and community leaders across the Twin Cities metropolitan area and the state of Minnesota have described declines in foot traffic, canceled events, reduced work hours, and, in some cases, the complete closure of businesses.
Reporting has described a widespread reduction in economic activity, relying on anecdotal accounts and small-scale surveys. These sources have been valuable in documenting the human experience of the operation, but have provided an incomplete picture of the scale of the economic harm. In particular, they have not quantified the overall change in consumer spending, or how changes vary across places and sectors. On February 13, City of Minneapolis officials gave one of the first quantitative economic accounts, estimating $203 million in harm to the city’s economy via lost restaurant, hotel, and retail revenues, and lost wages.
The analysis presented here represents another early effort to quantify Operation Metro Surge’s economic impact by harnessing high-frequency consumer spending data based on aggregated credit card transactions. By measuring changes in actual spending patterns from before and after the onset of DHS activities, relative to what would be expected based on changes in similar but unaffected areas of the country over the same time, this report provides a data-driven estimate of the economic losses in the North Star State.
The analysis yields substantial estimated impacts however there are reasons to hold these early estimates lightly and to await the arrival of additional data. In particular, the analysis suggests that:
- Consumer spending declined by an estimated 2.9% in Minnesota, representing a loss of $626 million in January 2026. Spending was down an estimated 1% in Hennepin County.
- Reductions in spending on food and accommodation were larger, dropping by 3.8% inthe state of Minnesota and 4.1% in Hennepin County.
We put these early results forward for public consideration, even though the data sources utilized are thin and provisional, making the estimates noisy and limiting the ability to reliably detect effects. Several aspects of the results warrant caution in interpretation, as we discuss in greater detail below. We will continue to update and enrich the analysis as more data become available.
Methods
Demonstrating the impact of DHS activities on consumer spending requires a comparison of what has happened against what would have happened without DHS activities. One could compare spending in January 2026 against the prior year. While useful, such comparisons fail to account for other changes over the course of a year. Perhaps spending in Minnesota was down in January 2026 compared to January 2025, but the cause lies with a change in the national economy, not DHS’s activity in the state. Alternatively, a comparison could be drawn between geographies, comparing Minnesota to Wisconsin, for example. Here, the limitation is that Wisconsin may not generally mirror Minnesota’s spending patterns, hurting the validity of any comparison.
To address these challenges, we use a synthetic difference-in-differences analysis. When analyzing the effect of DHS operations on Minnesota consumer spending, we consider monthly consumer spending data here alongside spending from all other states, looking back at all the months since January 2020. The algorithm finds the best way to weight other states and year- months so that the trend of their weighted average matches Minnesota’s observed trend across the months before the start of Operation Metro Surge. This weighted average represents a “synthetic” Minnesota, with a consumer spending trajectory very similar to Minnesota in the time leading up to the start of Operation Metro Surge.
Then, the analysis examines whether trends in the Real Minnesota and the Synthetic Minnesota continued in parallel or diverged after the surge of federal agents into Minnesota at the beginning of January 2026. By focusing on January 2026 as the “treatment” period, in which Minnesota experienced a surge of agents that other states did not, we are better able to isolate the impact of Operation Metro Surge, as it only affected Real Minnesota, not Synthetic Minnesota. Synthetic Minnesota’s observed trend represents what would have happened to Real Minnesota but for the start of DHS activities. Under this method, the observed difference between the Synthetic and Real Minnesota in January 2026 represents the operation’s estimated impact on Minnesota consumer spending in that month.
One can judge the credibility of the analysis by considering a few factors. First, how well does Synthetic Minnesota’s trend match Real Minnesota’s trend before January 2026? Are there states with similar enough trends that the algorithm can find decent weights to make a credible alternative to Minnesota, or are the trends not well-matched? We believe the matches are generally strong, though they fluctuate across different specifications. Readers can evaluate these matches for themselves using Figure 1 and Figures A1 to A6 in the appendix.
Second, did anything else unusual happen that would affect consumer spending, particularly some event in Minnesota that occurred at the same time that Operation Metro Surge accelerated in January 2026? If so, its effect would be comingled with the effect of Operation Metro Surge.Notably, we can’t think of anything substantial that fits this criterion.
Third, does the timing of the impact make sense? Do the trends diverge starting in January 2026 and not before, as we would expect? In several places, we see evidence of divergence between Synthetic and Real Minnesota happening before we would expect, indicating the need to interpret our results with caution in terms of their capacity to capture the impact of Operation Metro Surge.
Finally, for a given effect, what is the chance that the estimated impact at least that large would arise just by statistical chance, assuming that there really was no impact? That is to say, are we finding something statistically significant? As shown in Table A1 in the appendix, our results do not rise to traditional levels of statistical significance.
We begin with an analysis of Minnesota overall, but we also analyze some impacts for Hennepin County. In that case, we run the same synthetic difference-in-differences analysis as we described above, but with analogous counties (rather than states) from around the country.
Data
This analysis relies on consumer spending data from Opportunity Insights’ Economic Tracker, which uses anonymized credit and debit card transactions provided by Affinity Solutions. These data allow for the tracking of consumer spending at a monthly cadence across counties and states in the United States. The data were first gathered to analyze changes in spending due to the COVID-19 pandemic, meaning that they begin in January 2020.
To translate measured percentage changes in spending into dollar amounts, we pair the Affinity-based spending indices with data from the U.S. Bureau of Economic Analysis (BEA) on total consumer spending in Minnesota. This approach allows us to estimate the dollar value of foregone economic activity associated with observed declines in card spending.
Results
State of Minnesota:
All Consumer Spending
For our analysis of the state of Minnesota, we began by examining all consumer spending within the state. The graph below shows the trend in consumer spending in Real Minnesota and that of Synthetic Minnesota.
Synthetic Minnesota generally follows Real Minnesota consumer spending trends quite well, giving us greater confidence that any divergence seen in recent data represents a real impact in Minnesota. However, Figure 1 highlights that the divergence between Synthetic and Real Minnesota appears to start in November 2025, a month before Operation Metro Surge officially began and two months before the surge of thousands of DHS agents, which weighs against an interpretation that the decline in consumer spending in Real Minnesota was caused by the operation. It remains an open question as to why the data reveals this decline in November 2025.
Figure 1. All Consumer Spending- Synthetic Minnesota v. Real Minnesota
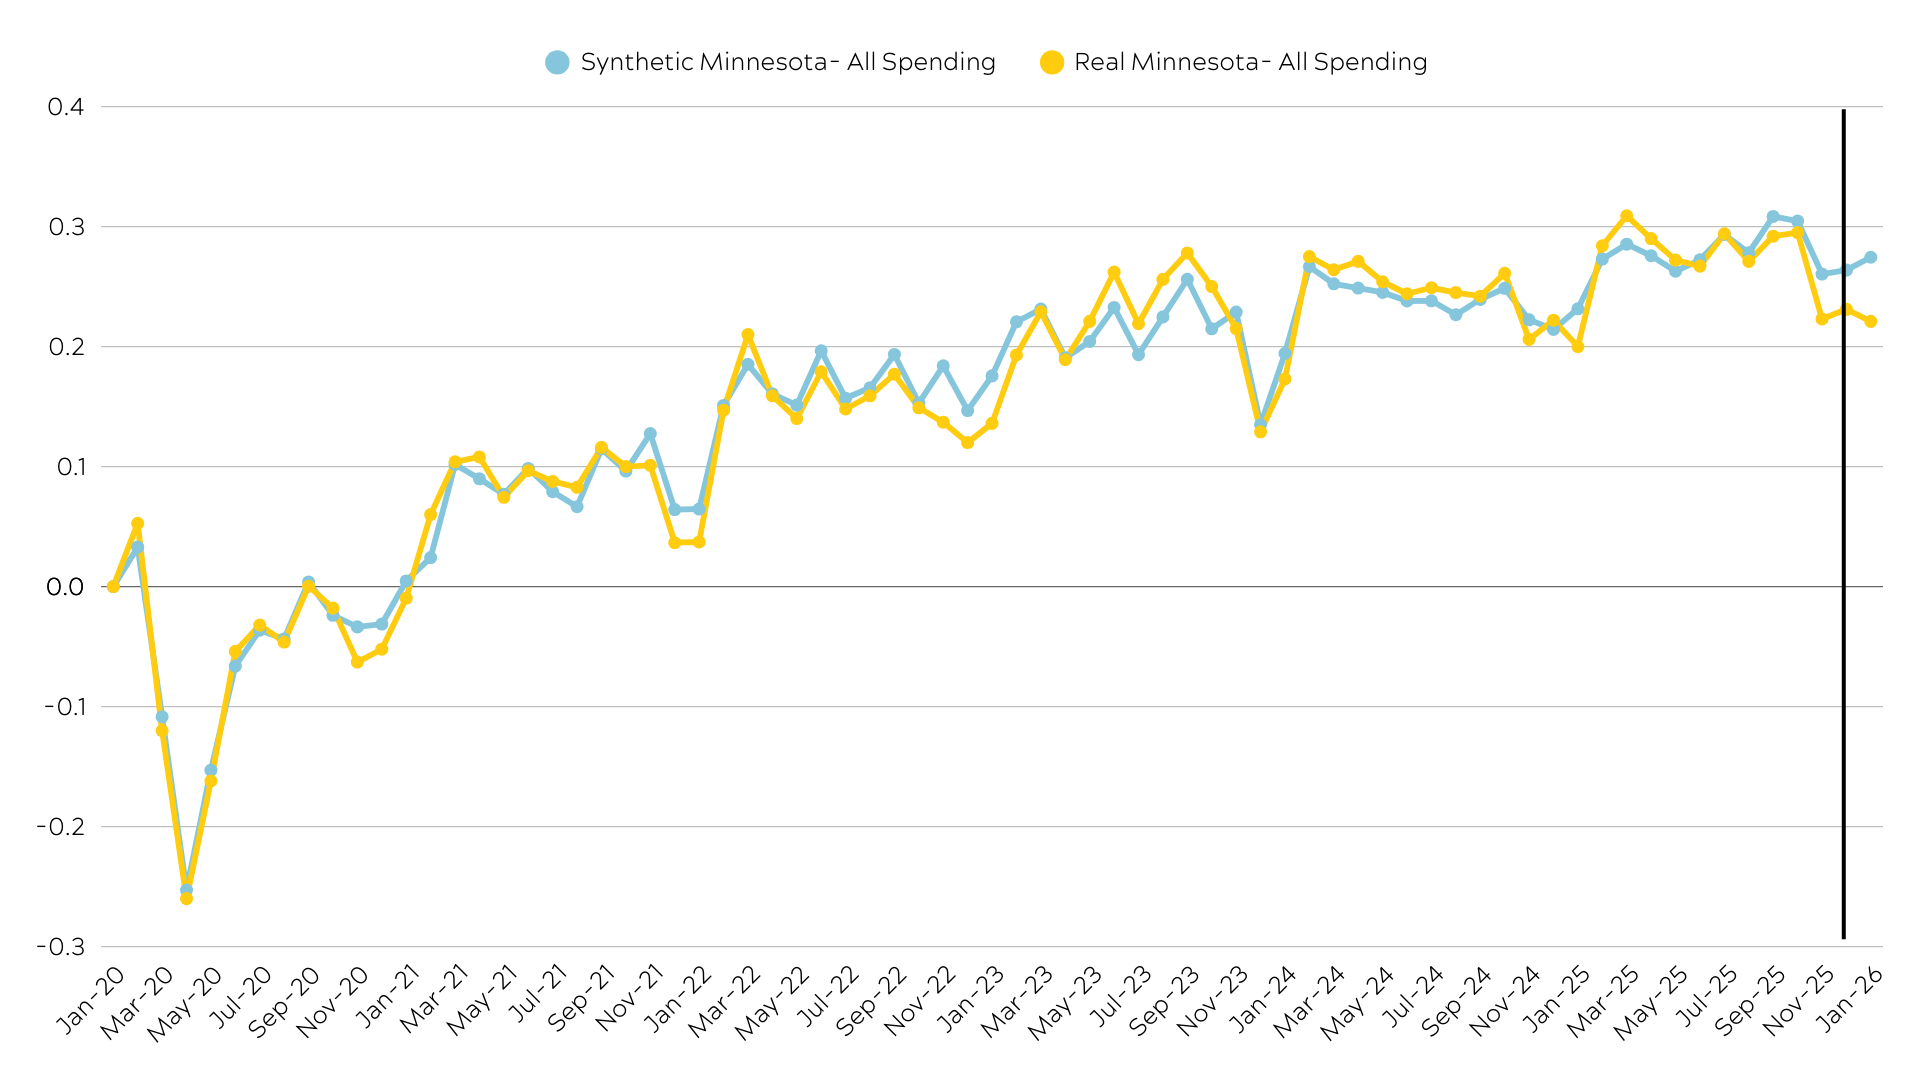 Note: the vertical black line marks December 2025, the month before DHS surged thousands of agents to Minnesota starting in the first week of January. Again, we treat January 2026 as the “treatment” period for our analysis.
Statistically, the analysis finds a 2.9% decline in consumer spending during January 2026 in Minnesota, relative to what would have happened otherwise. If we apply this percentage to the expected level of consumer spending in Minnesota in those months, it suggests a decline of $626 million. The analysis also shows that an estimated impact at least this large has a 28% chance to arise by chance even if the true impact was zero. See Table A1 in the appendix for more details on this measure of statistical significance.
We offer this early evidence for public consideration. The magnitude of the estimated impact is substantial. However, data are thin, making estimates noisy and limiting the ability to reliably detect effects. The too-early divergence and lack of statistical significance can occur because of sampling and measurement noise in the data, and warrants caution in the interpretation of the results, but not categorical dismissal. We will continue to update and enrich the analysis as more data become available. Similar caveats apply to the additional analysis below, but will not be repeated.
Spending by Income-Level
In addition to all consumer spending, the Affinity Data also provides consumer spending according to consumers’ neighborhood income levels. In particular, data are separated to represent spending by individuals living in the poorest fourth of zip codes, the second and third quarters combined, and the highest income quarter of zip codes. Given that DHS’s skin-color-based targeting strategies have pushed many immigrant and BIPOC Minnesotans of all citizenship statuses into hiding and that immigrant and BIPOC communities tend to be lower income in Minnesota, we would expect to see bigger declines in consumer spending among Minnesotans living in lower-income zip codes.
That expectation is not fully realized in our analysis. Instead, we see a slightly larger drop in middle-income spending (2.3%) than in lower-income spending (1.5%). Our expectation does align with the findings for higher-income spending, which saw a slight jump in January 2026 in Real Minnesota (0.8%) when compared to Synthetic Minnesota. Neither the impacts nor the differences in impacts are statistically significant. The graphs for these results can be found in the appendix.
Spending on Food and Accommodation
A final piece of our state-level analysis examines an area where reporting suggests spending might have declined a particularly large amount: food and accommodation. Accounts of restaurants losing revenue have been heavily featured in the media. The Affinity data provides a category of consumer spending focused on food and accommodation. Once again, our results conform to our expectations. With a 3.8% decline in food and accommodation spending, it would appear that the damage done in this segment of the economy was larger than that done to consumer spending overall (2.9%). A 3.8% drop in food and accommodation spending would represent a $46 million loss in the state.
Hennepin County:
We turn now to an analysis of consumer spending changes in Hennepin County (labeled Minneapolis in the Economic Tracker data). Given that the activities of Operation Metro Surge concentrated in the Twin Cities area, we would expect that the declines in consumer spending would be larger in Hennepin County than statewide.
The analysis does not confirm that expectation. When looking at all consumer spending in the county, the estimated percentage drop is smaller than at the state level (1% in Hennepin County compared to 2.9% for the state). This decline would represent approximately $43 million in consumer spending.
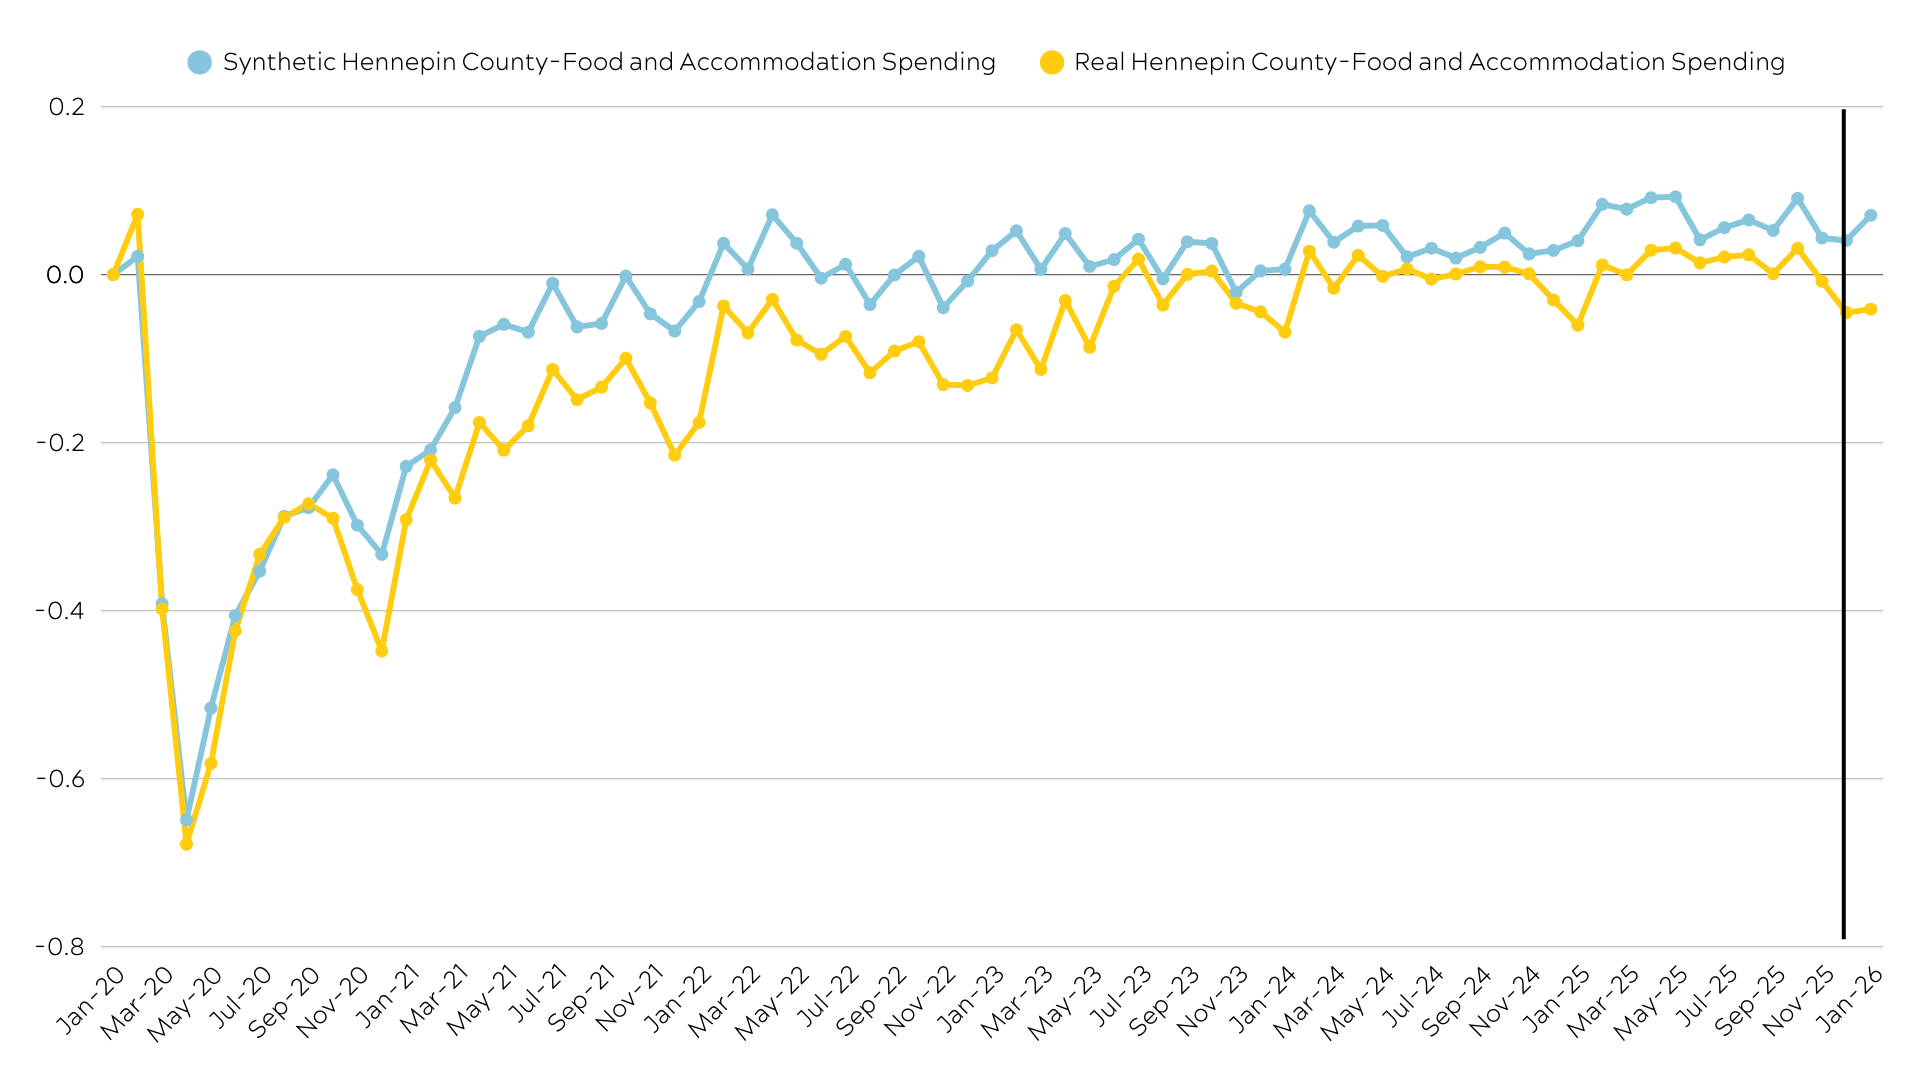
Finally, we examine food and accommodation spending in Hennepin County. The estimated 4.1% reduction is similar but slightly larger than the estimated impact on total consumer spending in the county. The estimated reduction is also slightly larger than the estimated
reduction at the state level (4.1% in the county compared to 3.8% in the state), as we would expect.
Limitations
These results are suggestive but not definitive in showing an economic impact from Operation Metro Surge. This should not be confused with a claim that economic activity continued as normal in the Twin Cities in January of 2026. Accounts from neighborhood residents, local officials, and business owners about closures and reduced revenue indicate that there was an impact in the Twin Cities. There are several possible explanations for why this impact is not definitively captured by the analysis.
Most plausibly, the Affinity data represent consumer spending aggregated to the state and county level. It may be that the reductions in revenue were too concentrated in specific areas to show up in data measured at this relatively broad geography. As more fine-grained data becomes available, future analyses will be better able to capture these concentrated effects. An additional limitation in our analysis is our focus on consumer spending, which represents just one aspect of potential economic damage. For example, the previously mentioned City of Minneapolis report found that Operation Metro Surge led to $47 million in lost wages. While some of that impact might show up in our results due to lower wages causing weakened consumer spending, our analysis does not measure and is not able to capture wage reductions themselves. Notably, it is possible that data for subsequent months will reveal a rebound in consumer spending, though this reduction in wages might also lead to ongoing declines in consumer spending that extend beyond January. Harms done to other areas, such as education and housing, similarly fall outside the scope of our analysis.
Appendix
More Details on Data Sources:
Affinity Data
The Affinity data represents approximately 10% of all card spending in the United States, making it a robust source for tracking trends in consumer spending using credit and debit cards. One implication of this coverage is that spending in cash-intensive settings may be underrepresented. To the extent that some affected communities rely more heavily on cash transactions, the declines estimated here are conservative.
U.S. Bureau of Economic Analysis Data
To estimate dollar losses, we use BEA data on consumer spending in Minnesota for 2019. As the Affinity data provides percentage changes in spending since January 2020, we utilize 2019 spending data as the best proxy for this baseline indicator in the Affinity Data, recognizing that annual data from 2020 would include the impact of the pandemic, which began after January 2020. Dollar losses are obtained by multiplying the percentage declines observed in the Affinity data by the consumer spending total in Minnesota in 2019, as well as totals in spending on food services and accommodation.
For Hennepin County, we estimate total consumer spending by assuming that spending is proportional to population. Because approximately 21.9% of Minnesota’s population resides in Hennepin County, we assume that approximately 21.9% of statewide consumer spending occurs there as well. To the extent that Hennepin County accounts for a disproportionate share of economic activity in the state, this assumption likely leads to an underestimation of true dollar losses.
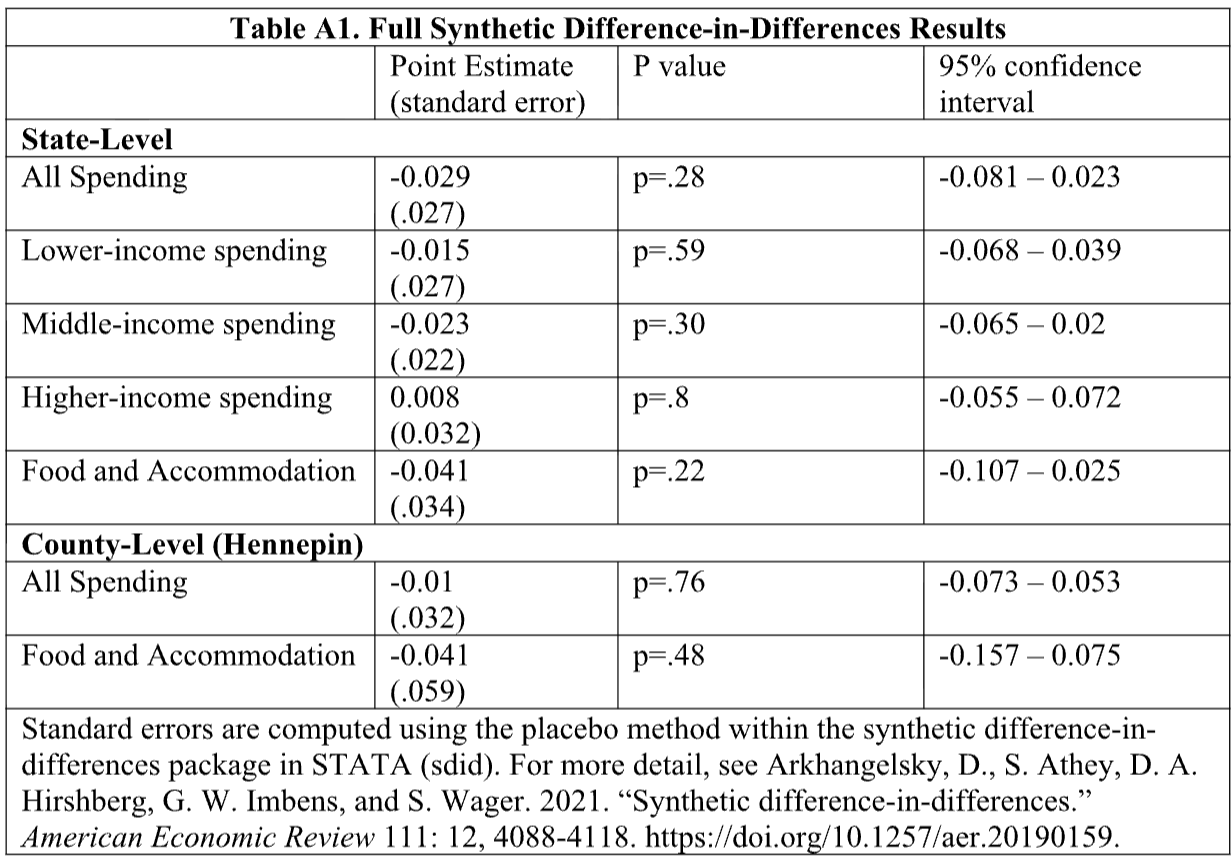
Detailed Results
Table A1 provides the full results for the synthetic difference-in-differences analyses discussed above. While there is some variation, results are often considered statistically significant when the p–value is below .05, which we could interpret in this case as a less than 5% chance that an estimated impact would arise by chance, even if the true impact is 0. As seen in the table below, none of our results reach this traditional level of statistical significance, indicating that our results should be interpreted with caution.
Synthetic Difference-in-Differences Figures
The figures below show the results of our synthetic difference-in-differences analysis in graphical form. This visual component of our results provides a greater illustration of the degree to which the Synthetic Minnesota/Synthetic Hennepin County created in our analysis mirrored the consumer spending trajectories in Real Minnesota/Real Hennepin County in the time leading up to January 2026. The better the fit between the two trajectories, the more confident we can be in our results.
Figure A1. Lower-Income Consumer Spending- Synthetic Minnesota v. Real Minnesota
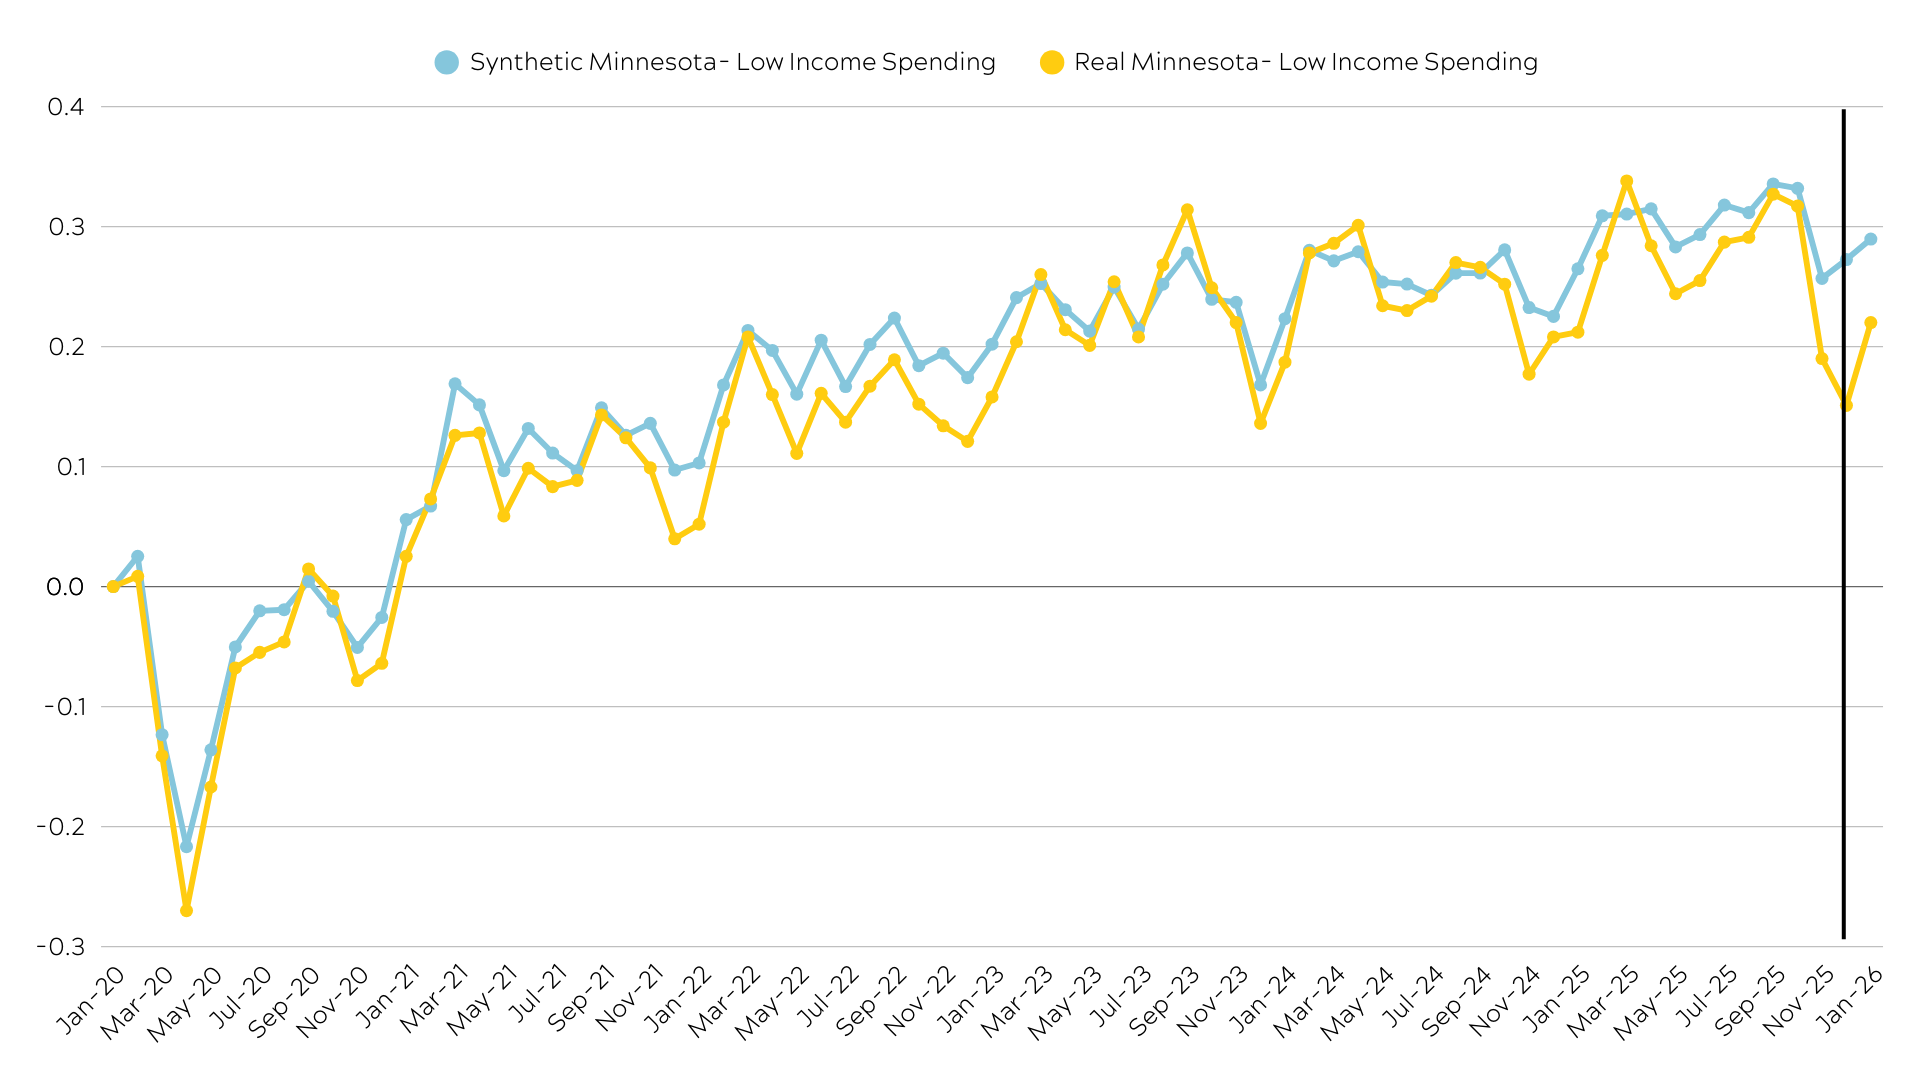
Figure A2. Middle-Income Consumer Spending- Synthetic Minnesota v. Real Minnesota
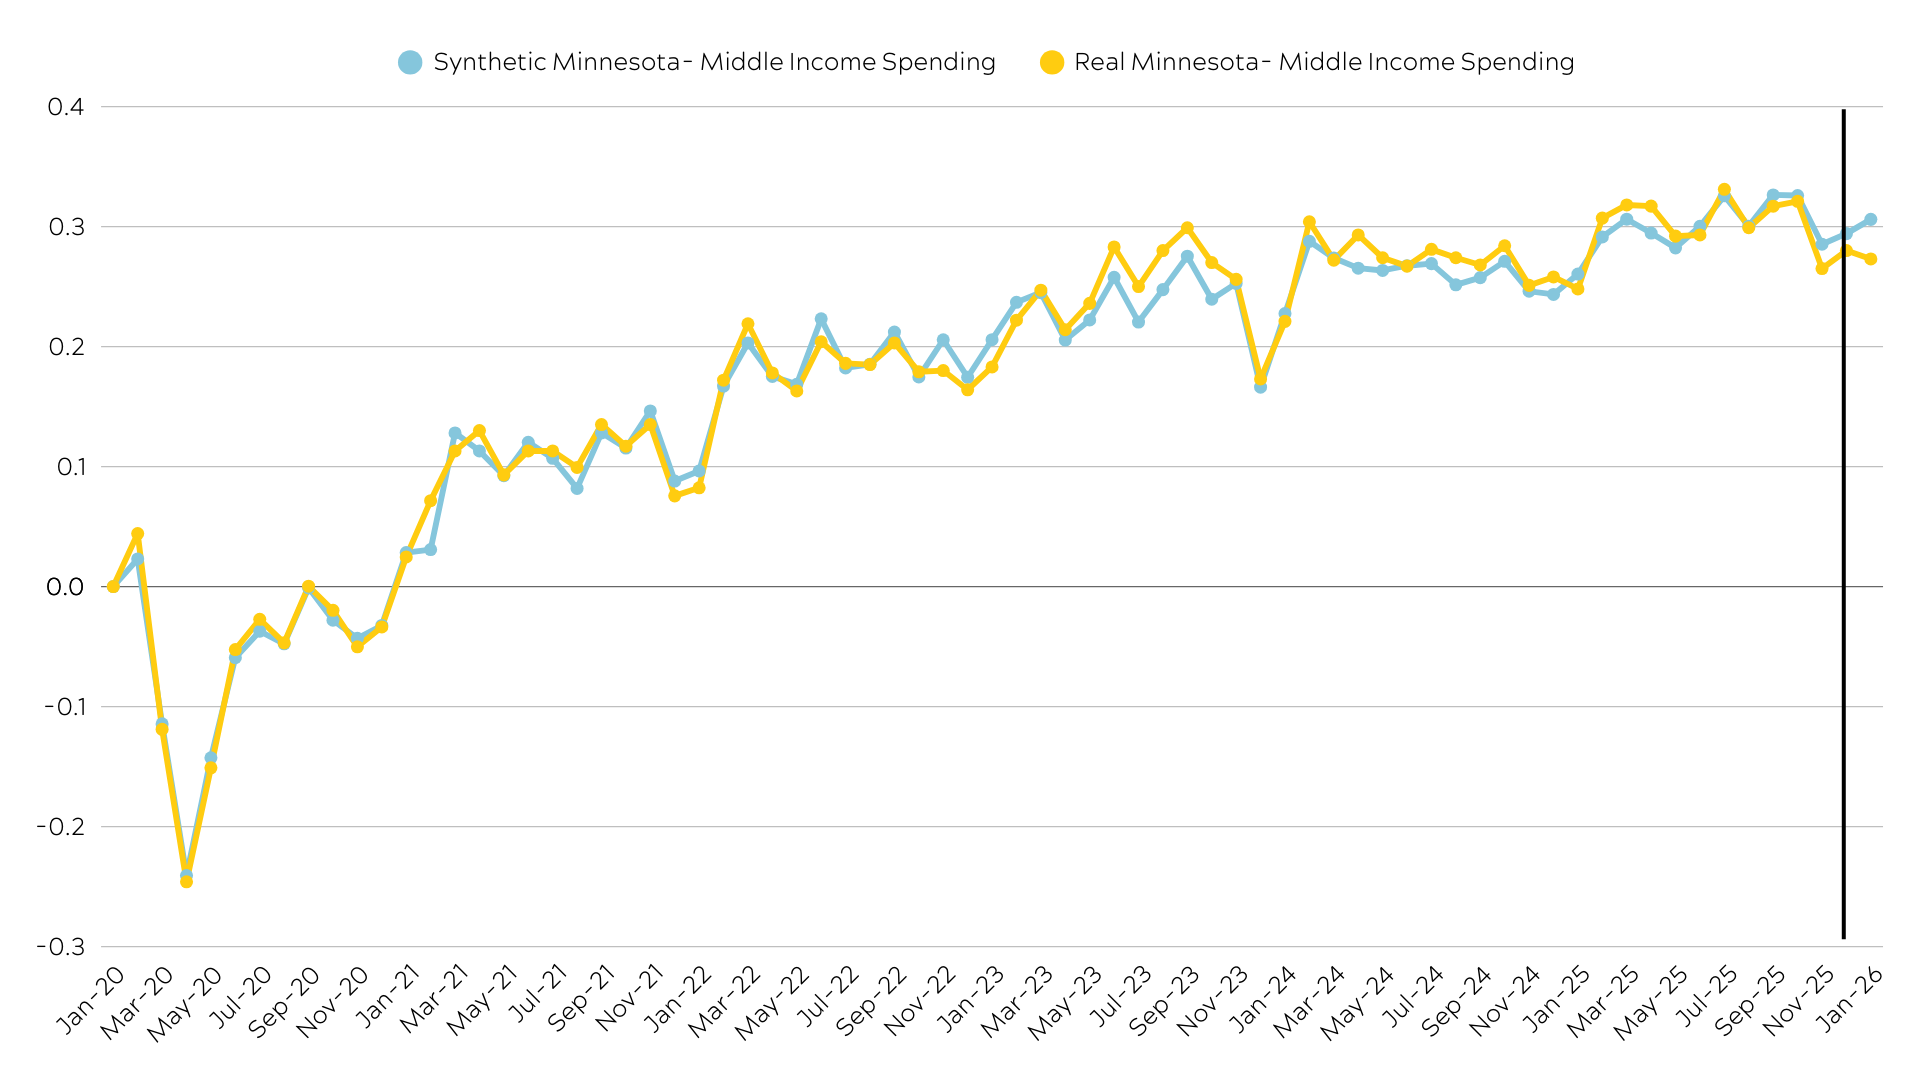
Figure A3. Higher-Income Consumer Spending- Synthetic Minnesota v. Real Minnesota
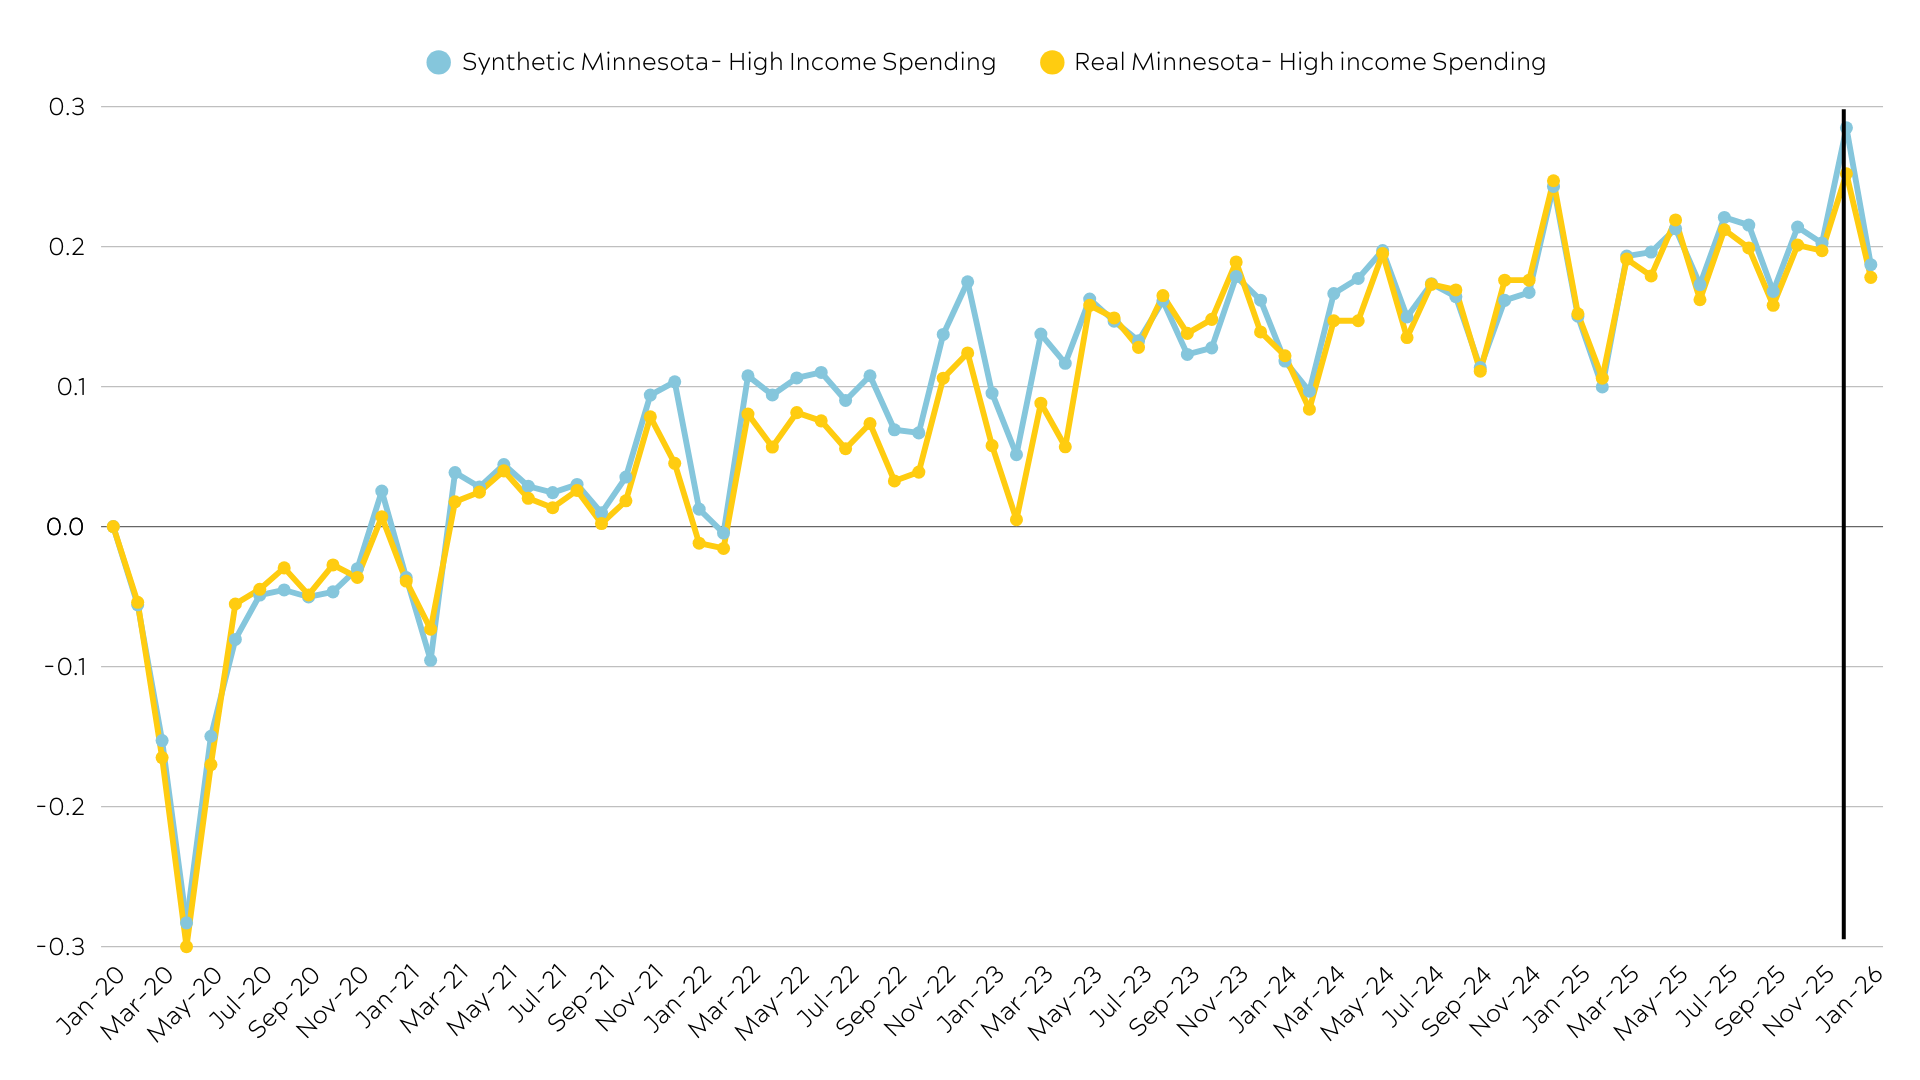
Figure A4. Food and Accommodation Spending- Synthetic Minnesota v. Real Minnesota
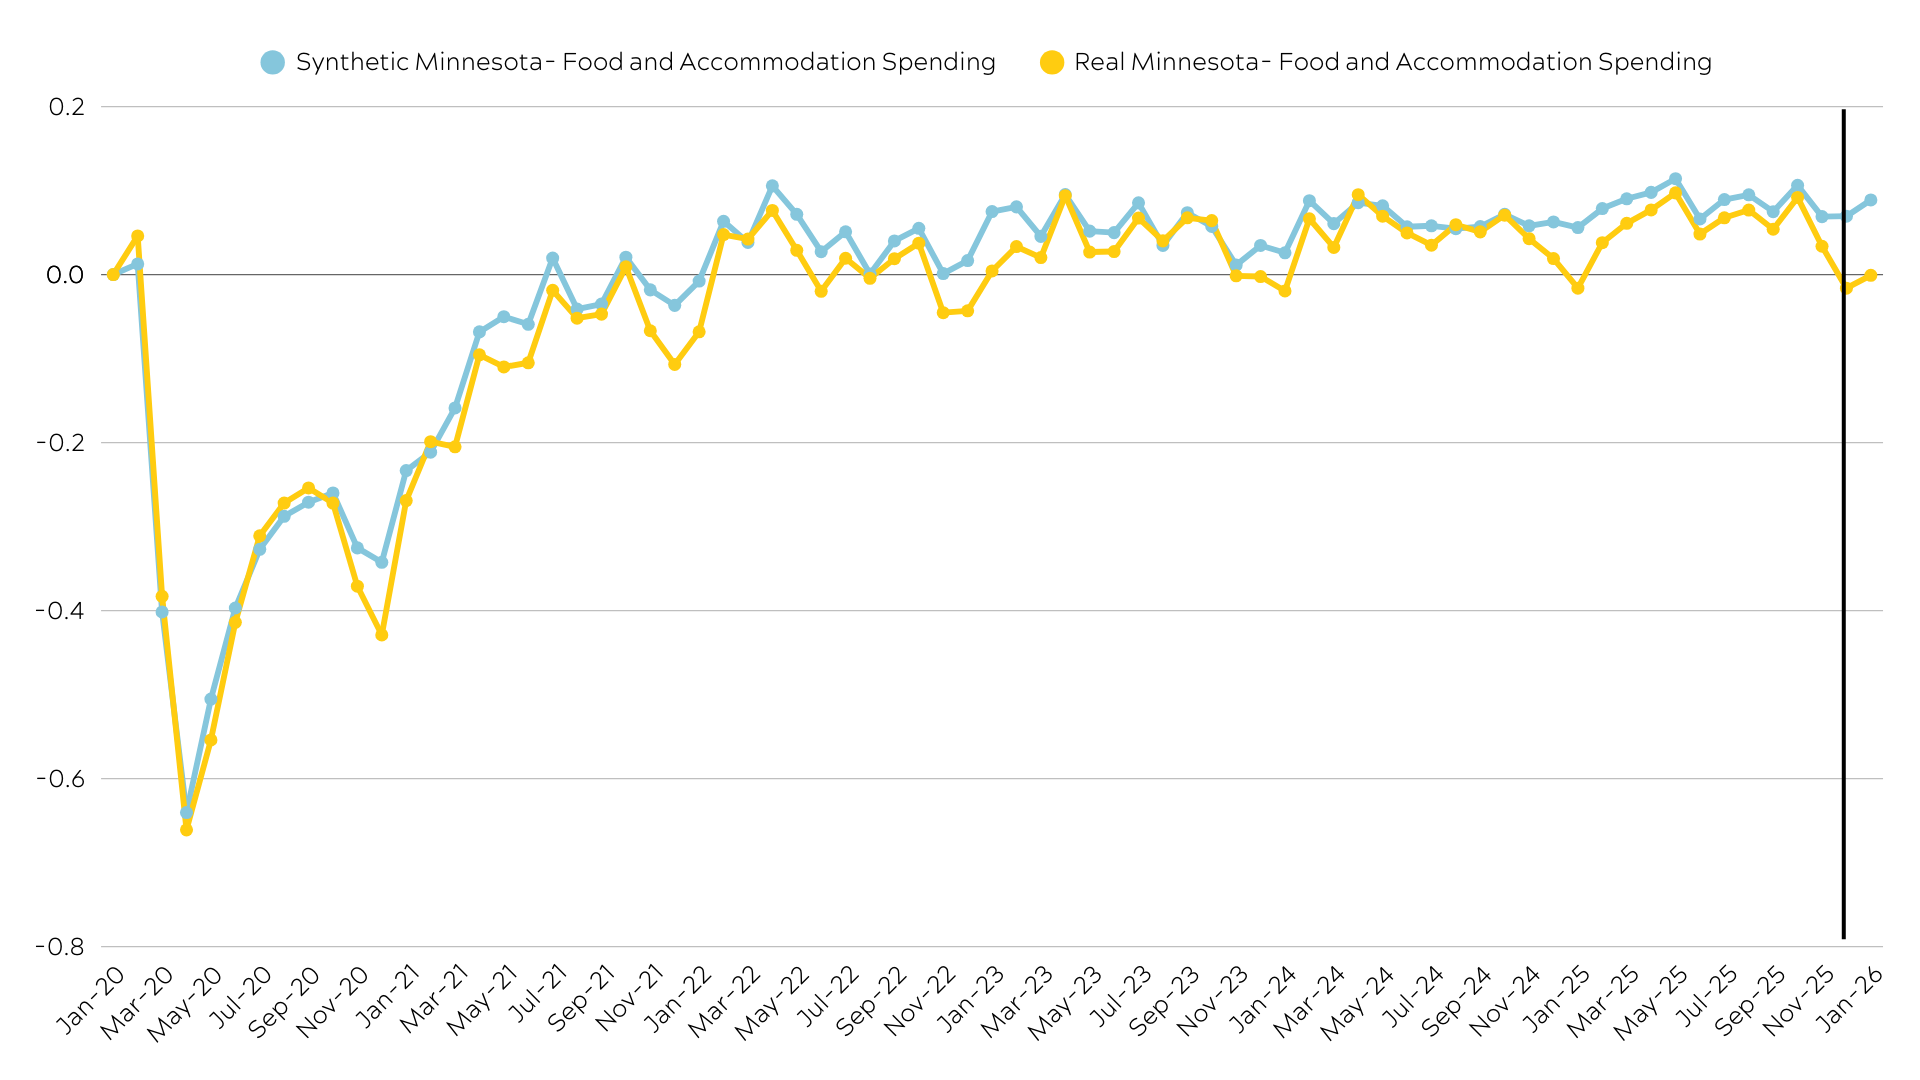
Figure A5. All Consumer Spending- Synthetic Hennepin County v. Real Hennepin County
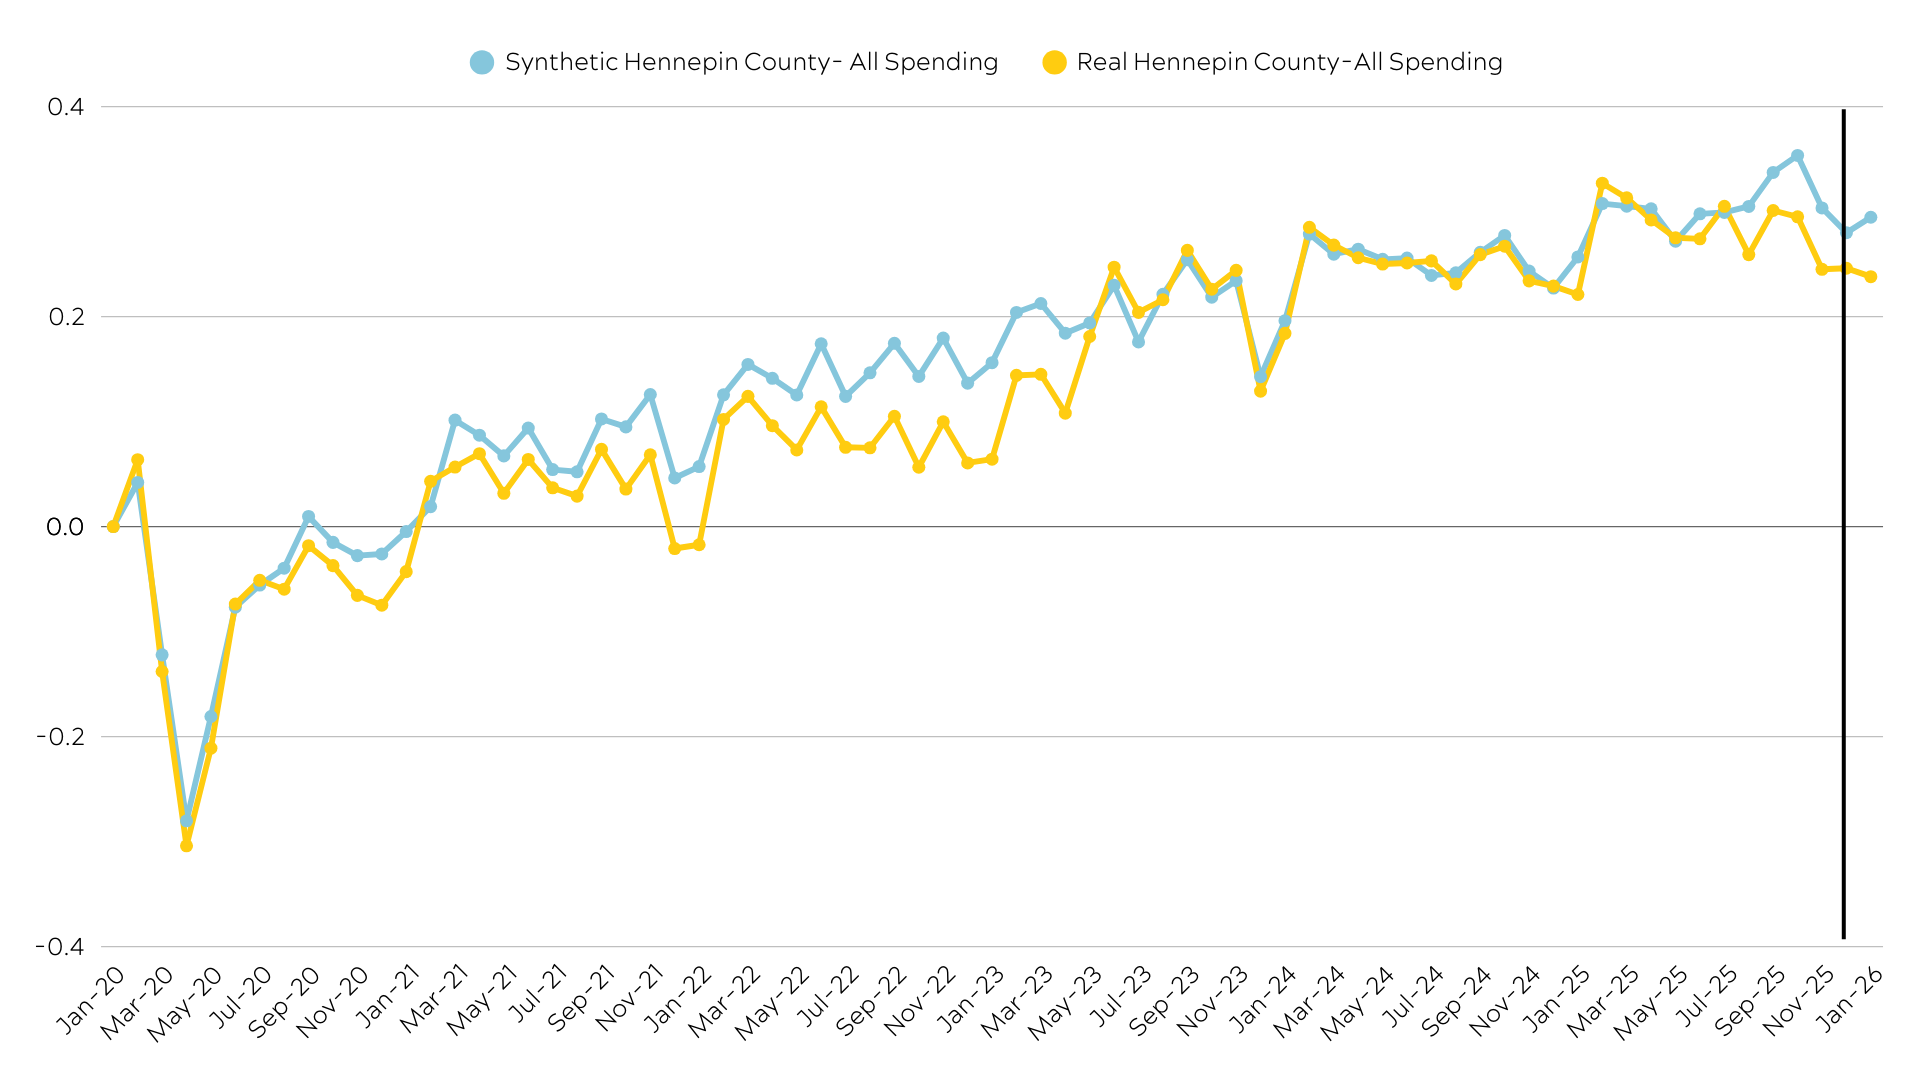
Figure A6. Food and Accommodation Spending- Synthetic Hennepin County v. Real Hennepin County
Endnotes:
- In the case of our Hennepin County analysis, the creation of a Synthetic Hennepin County relies on spending data in 52 other counties that are provided by Affinity Solutions for Opportunity Insights’ Economic Tracker. These counties represent most of the major metropolitan areas in the US (see the Metros tab of the Economic Tracker dashboard for a list of these areas).
- For instance, the police chief of suburban Brooklyn Park discussed how DHS agents targeted many of the department’s officers while they were off duty in civilian appearance but DHS only targeted BIPOC officers, no officers who were white.