On April 2, the Minnesota Department of Employment and Economic Development (DEED) released new labor market data for January 2026, giving us the first concrete look at how Minnesota’s economy fared in the immediate aftermath of Operation Metro Surge. The picture is not a good one.
For the first time since 2007, Minnesota’s unemployment rate now exceeds the national rate — 4.4 percent compared to 4.3 percent nationally. Some have debated whether this reflects a trend that was already underway or a new decline driven by Operation Metro Surge. The honest answer is that both factors are likely at play. But a closer look at the numbers provides much stronger evidence that Operation Metro Surge did real, measurable damage to Minnesota workers and businesses.
Workers Are Logging Fewer Hours Than at Any Point in Nearly Two Decades
One of the most striking findings buried beneath the headline unemployment numbers is a drop in average hours worked. In January 2026, the average private-sector worker in Minnesota logged just 32.1 hours per week, representing the lowest recorded figure since at least 2007.
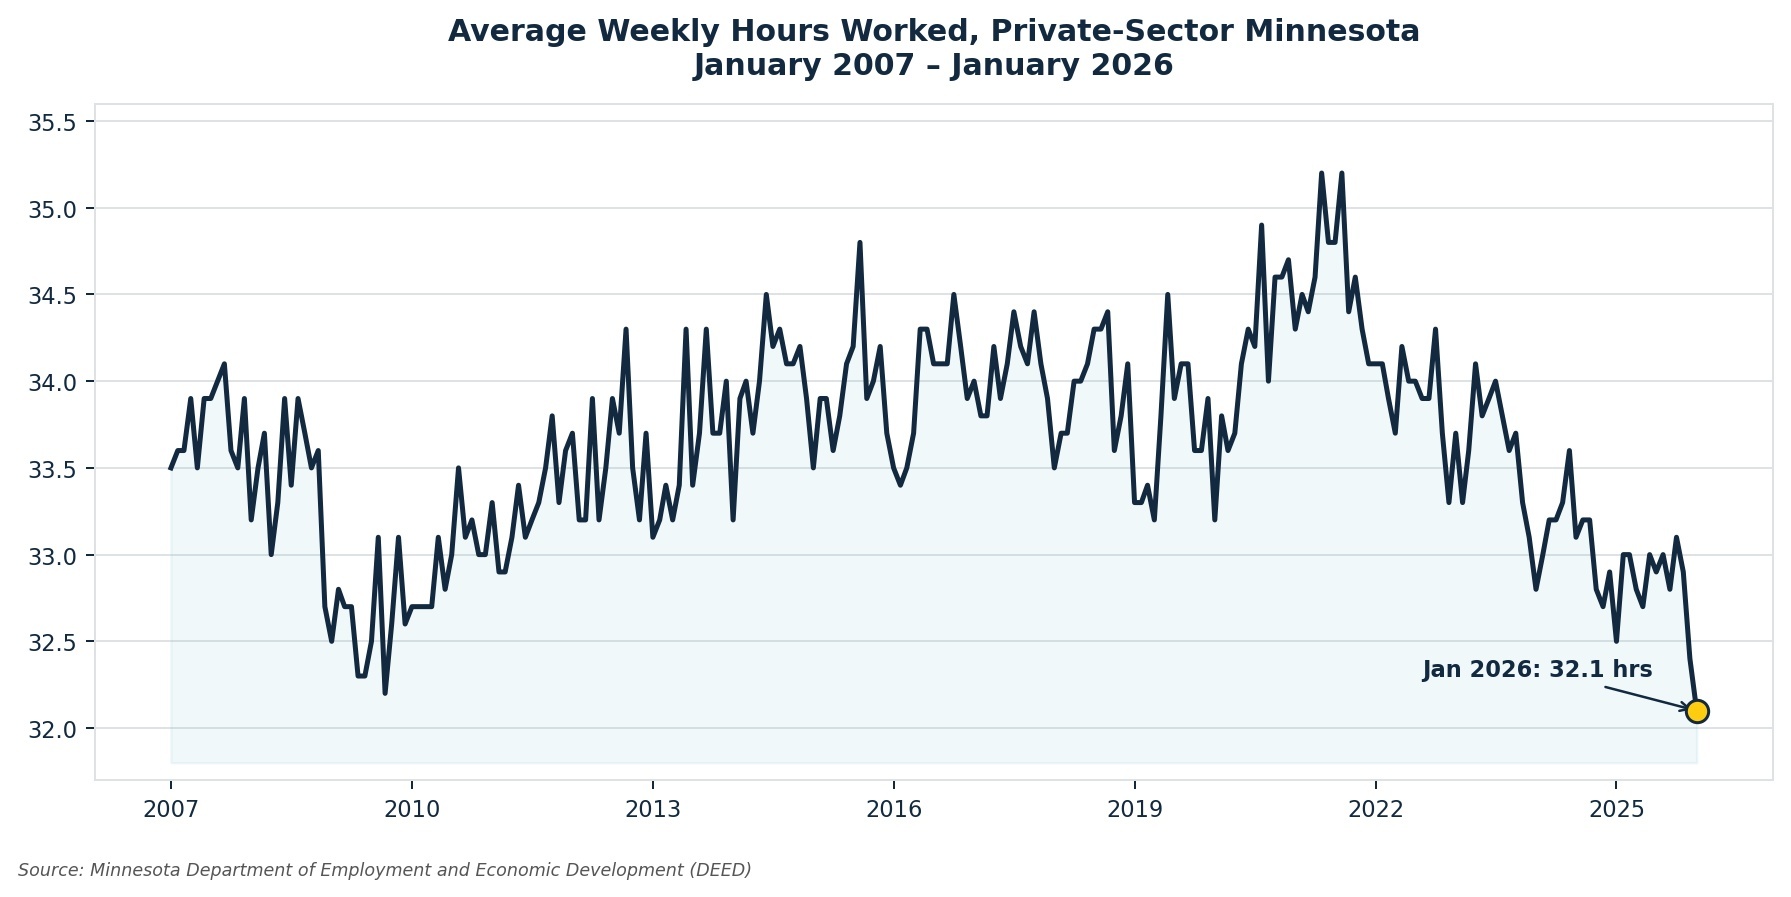
Figure 1: Average Weekly Hours Worked, Private-Sector Minnesota, January 2007–January 2026. DEED Current Employment Statistics.
This finding is particularly significant because it aligns with our previous analysis, which found that Operation Metro Surge’s greatest impact on workers may not have been outright job loss, but rather a sharp decline in hours as workers stayed home out of fear, businesses reduced shifts due to uncertainty, and operations contracted in communities targeted by enforcement activity. Using conservative assumptions, our analysis estimated that this drop in hours translated to more than $106 million in lost wages in the Twin Cities alone.
The Industries Targeted by Enforcement Took the Hardest Hit
Much of the reporting following Operation Metro Surge focused on the restaurant industry, and the new data confirm that concern. Leisure and hospitality, the sector that encompasses restaurants, hotels, arts, and entertainment, lost 4,000 jobs in January 2026 alone. Of the jobs lost, 3,300 came from accommodation and food services, while arts, entertainment, and recreation shed 700 jobs.
Excluding the pandemic, these are the largest employment declines Minnesota has seen in both leisure and hospitality and accommodation and food services since 2007.

Figure 2: Leisure & Hospitality Employment, Minnesota (Seasonally Adjusted), January 2025–January 2026. DEED Current Employment Statistics.
The Twin Cities Bore the Brunt
The geographic pattern of job losses further reinforces their connection to Operation Metro Surge. Overall, the Twin Cities metropolitan area lost 2,000 jobs in January 2026, representing a 0.1 percent decline in total nonfarm employment. Greater Minnesota, by contrast, gained 711 jobs over the same period.
This geographic concentration is even sharper when you isolate the industries most targeted by immigration enforcement. On an annual basis, the Twin Cities saw a 4.2 percent decline in leisure and hospitality employment, far outpacing the statewide decline of 2.4 percent and well above the national drop of just 0.1 percent.
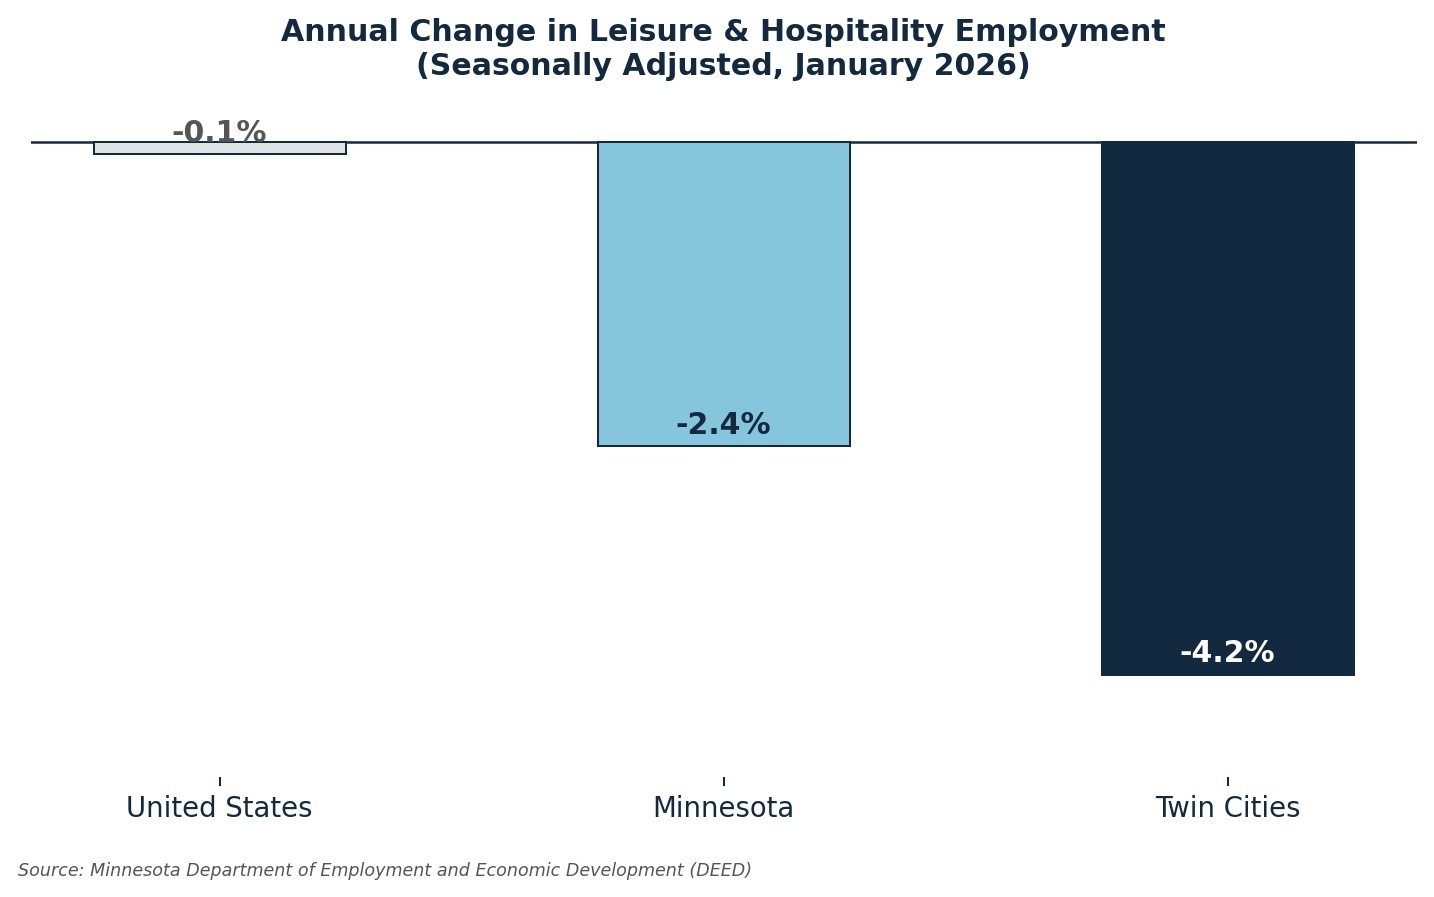
Figure 3: Annual Change in Leisure & Hospitality Employment (Seasonally Adjusted, January 2026), United States, Minnesota, and the Twin Cities. DEED Current Employment Statistics.
That kind of divergence, wherein the Twin Cities fared dramatically worse than both the state and the nation in the industries most affected by enforcement, is difficult to explain without accounting for the role Operation Metro Surge played.
These Numbers Likely Understate the True Damage
As significant as these findings are, there are strong reasons to believe that the official data only tell part of the story. These statistics capture lost jobs. But as we noted in our earlier analysis, the most immediate impact of Operation Metro Surge may not have been workers losing jobs, but workers not showing up. People who stayed home out of fear and retained their job are not showing up in most of these measures.
In other words, we should treat these January numbers as additional and significant evidence of the damage done by Operation Metro Surge, but not as a complete accounting of its costs, especially as we await data releases capturing any impacts in subsequent months. The full picture, whenever it comes into focus, is likely to look considerably worse.