By Aaron Sojourner, W.E. Upjohn Institute for Employment Research and Aaron Rosenthal, Northstar Policy Action
This analysis aims to quantify key economic impacts of the U.S. Department of Homeland Security’s (DHS) surge of agents starting in early January 2026 to Minnesota on labor outcomes. In particular, the analysis focuses on daily measures of Minneapolis-Saint Paul (MSP) metropolitan area activity for the following three variables: 1) number of employees working, 2) total hours worked, and 3) business locations operating. Results are discussed first. Methods are detailed later.
The analysis finds that the DHS agent surge reduced the number of employees working 2.8% below expectations, total hours worked by 1.9%, and the number of business locations open by 1.7% in the Minneapolis-Saint Paul (MSP) metro area through February 17, 2026. This suggests, plausibly, that hours per working employee increased slightly. Applying the average hours worked impact estimate to a conservative model of aggregate earnings implies an estimated $106 million in lost wages.
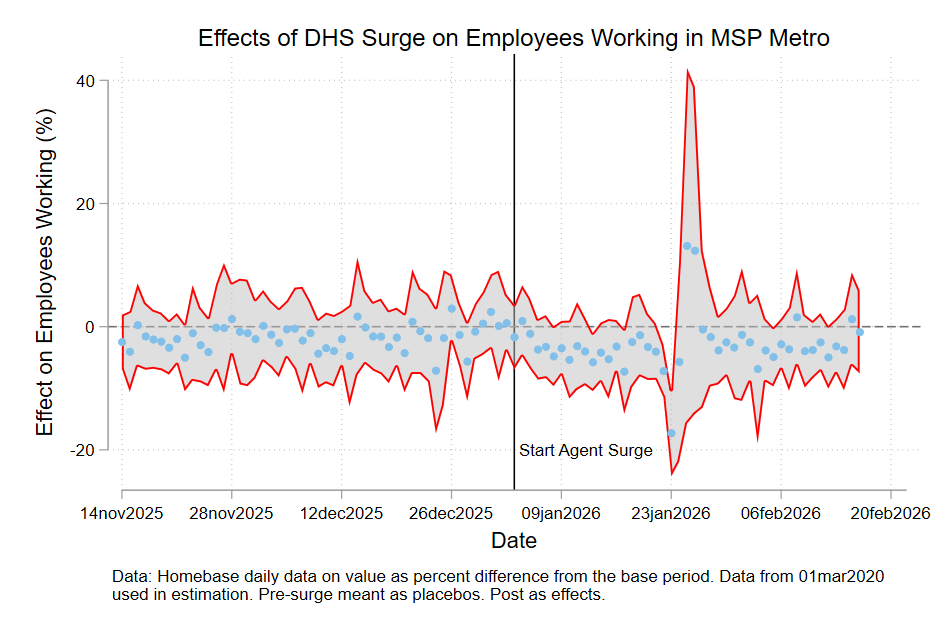
The figure above shows a set of day-specific estimated effects of the agent surge on employees working measured in percentage points. Each blue dot represents how many percentage points away the number of employees clocking in was from its expected value. Expectations are measured based on trends in other metro areas with similar trends in the years leading up to this period. The grey area describes a margin of error.
The pattern of estimated effects adds credibility. For each of the 50 days before the agent surge, it displays an estimated daily “placebo effect.” These are each expected to equal zero because the agent surge hadn’t happened yet. After the agent surge started on January 3, the number of employees clocking into work averaged 2.8% below expectations across all days. The number of employees working was furthest below expectations, -17%, on January 23. This was the day of the large Day of Truth and Freedom march that rallied people with the slogan “No Work. No School. No Shopping.” That this result emerges from the estimates also adds credibility to the results.
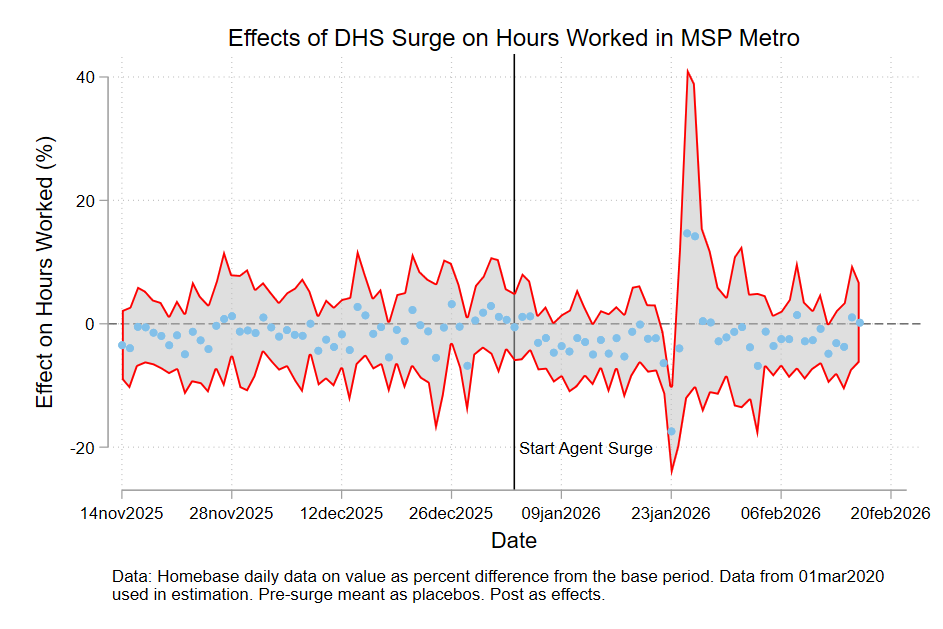
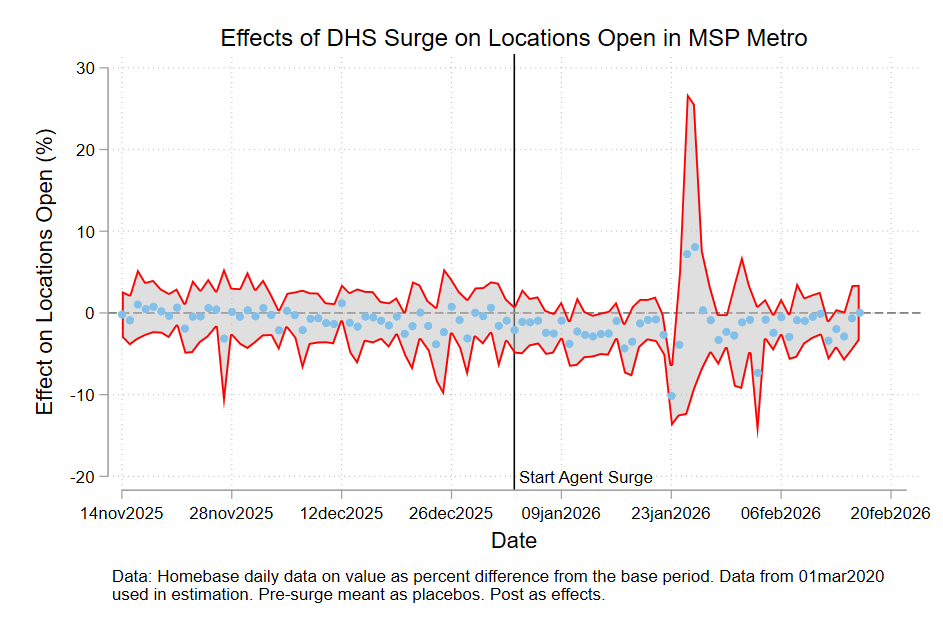
Equivalent analyses for total hours worked and the number of business locations open show similar patterns, as displayed below. Hours worked are down about 2% on average over the whole post-surge period, with larger effects before the January 23 march and a drift back towards expectations since.
Estimating Lost Wages
Conservatively, this implies an estimated $106 million in lost wages based on:
Wage Impact = (% impact on employee hours) x (average employee dollars per hour) x (average employee hours per week) x (number of weeks) x (number of employees)
The analysis above implies that the percent impact on employee hours is -1.9%. Our data source may overstate the size of the effect in the whole metro economy because it is commonly used by small businesses, where effects may have been larger. To compensate for this, we use very conservative assumptions on the other parameters. Average employee dollars per hour are proxied, very conservatively, by the $16.93 median hourly wage of food prep and serving employees in the metro area, one of the lowest paid occupational groups, a year prior in 2025Q1. Average employee hours per week will be proxied, again very conservatively, by the 25.5 average weekly hours of U.S. private sector accommodation and food service employees. The number of weeks is 6.4. The number of employees is 2.0213 million as of Nov 2025. So,
Wage Impact = (-0.019) x ($16.93) x (25.5) x (6.4) x (2,021,300) = -$106.1 million
One could use any set of less conservative assumptions.
- Median hourly wage of all MSP metro employees was $28.48, 68% higher than the $16.93 used above. Alternatively, the average hourly wage of all MSP metro employees is $34.73,105% higher.
- Average weekly hours of all private sector employees is 35% higher.
- The value of insurance, retirement and savings, paid leave, and supplemental pay benefits in the U.S. accommodations and food services industry typically add another 11% hourly above wages.
Changing the weekly hours assumption alone boosts the lost wages estimate to $143.2 million.
We also used similar methods as presented here, but different data, to estimate the impact on consumer spending in Minnesota in January. The City of Minneapolis estimates $47 million in lost wages just for Minneapolitans through the end of January. The city’s lost wages estimate is based on analysis of American Community Survey data from 2020-2024 to estimate the number and earnings of foreign-born Minneapolitans, along with assumptions about the share of income lost. It doesn’t use any information from after 2024. Minneapolis jobs constitute just 16% of MSP metro jobs, but likely a disproportionate share of jobs affected.
Methodology
We draw on real-time data from a small-business timekeeping and payroll platform, Homebase. It captures changes in hours worked, employees working, and locations open due to either permanent closures or, importantly, to activities going temporarily dormant. Variables are expressed as the daily percentage difference from their level in a base period. The daily data run from March 1, 2020 to February 15, 2026.
For each outcome, we estimate a synthetic difference-in-differences (SDID) model using the available 49 other metro areas as potential comparisons. The SDID algorithm weights these comparison metro areas and time periods optimally so that the weighted average of its trend in the years leading up to the agent surge best matches the real MSP’s trend. The figure below focuses on employees working and contrasts the Real MSP’s trend (blue) with the Synthetic MSP’s trend (red). The fact that the trends don’t line up perfectly detracts some credibility from the analysis. The weighted combination of comparison metros’ data can’t do a perfect job of matching the MSP metro’s earlier trend.
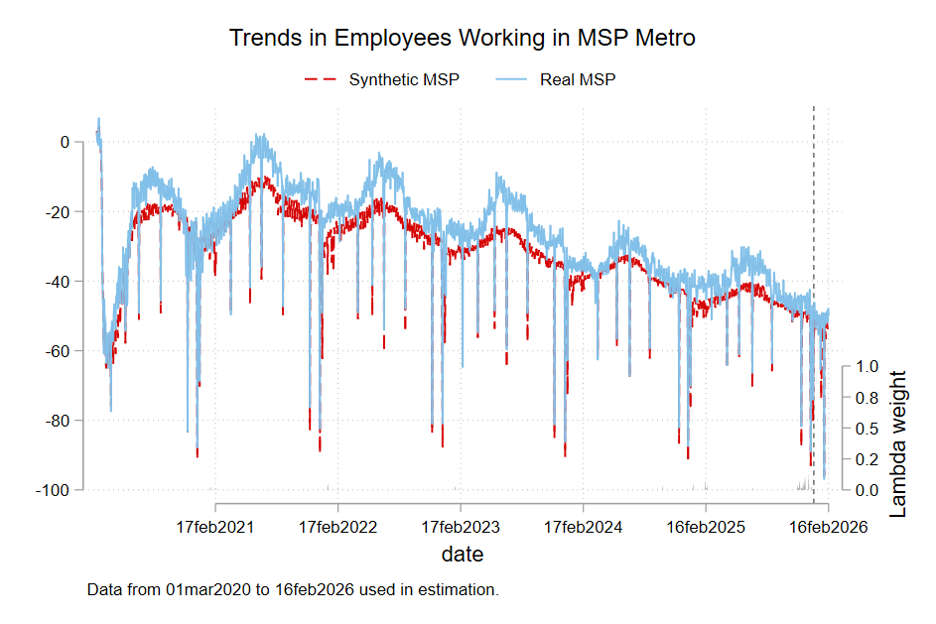
However, the fact that in the first figure of the blog, the 50-day placebo period immediately before the surge’s start is full of null estimates but daily estimates shift down immediately after the surge’s start suggests the model is picking up an MSP-specific change in outcomes at that date. The timing of that dip does not have to happen by construction. It is a result. In the event study analysis, expectations are based only on the period from March 1, 2020 through 50 days before the surge’s start. Roughly speaking, the 3 figures presented earlier show daily effects defined by normalizing the red line here to equal zero and measuring effects as deviations of the blue Real MSP line from the red Synthetic MSP line.
One alternative and possible explanation of the estimated effects is that a differential seasonal pattern happens to hit MSP early every January. To check that, we repeat the event study analysis, but pretend that the DHS agent surge happened a year earlier, shifting back the analysis by 365 days. In that analysis, the average estimated effects for:
- Hours worked is -0.1% with a confidence interval of -2.6% to 2.3%.
- Employees working is 0.9% with a confidence interval of -1.7% to 3.5%.
- Locations open is 0.1% with a confidence interval of -2.0% to 2.1%.
That these estimates are so different and much smaller than the estimates using the true 2026 surge timing suggests that the effect described in the body is not just a repeat of what happens annually around this time of year.
An alternative way of guarding against seasonality is to include month controls in the analysis. Under that specification, the point estimate of the effect on:
- Employees working edges down from -2.8% to -2.9%, and the confidence interval widens slightly to -5.5% to -0.2%,
- Total hours worked doesn’t change from -1.9%, and the confidence interval widens to -5.0% to 1.2%,
- Locations open remains unchanged at -1.7%, with the confidence interval widening to -3.0% to -0.3%.
All of these results suggest that seasonality does not explain the pattern we find.
Endnotes:
- The agent surge is assumed to start on January 3, 2026 given that it was announced as substantially underway on January 6. https://minnesotareformer.com/2026/02/20/a-chronology-of-operation-metro-surge/
- Those estimates are average treatment effects among the treated in the post-agent-surge period with 95% confidence intervals -4.9% to -0.8% for employees working, -4.7% to 0.8% for hours worked, and -2.4% to -1.0% for locations open.
- A 95% confidence interval. Inference is done by placebo method with 100 draws for each model.
- We utilize data from the Homebase platform, which provides a daily count of employees working, hours worked, and business locations open utilizing data from over 100,000 businesses and 2 million employees in 50 metro areas. More information on this data source can be found in our Methodology section and at https://www.joinhomebase.com/data. Thanks to Homebase and to the University of Chicago for making the data accessible for this analysis.
- https://mn.gov/deed/assets/2025_TwinCities_tcm1045-133250.pdf
- https://www.bls.gov/iag/tgs/iag72.htm
- https://www.bls.gov/regions/midwest/summary/blssummary_minneapolis.pdf
- https://mn.gov/deed/assets/2025_TwinCities_tcm1045-133250.pdf
- https://data.bls.gov/oes/#/area/0033460
- https://data.bls.gov/dataViewer/view/timeseries/CES0500000002
- https://www.bls.gov/ecec/tables.htm
- The City of Minneapolis hosts 321,146 jobs, constituting only 16% of MSP metro jobs. https://www.minneapolismn.gov/media/-www-content-assets/documents/Mpls_GO_2025_Final-OS.pdf