In recent decades, income inequality has increased, both in Minnesota and nationally. New information from the American Community Survey (ACS) shows that U.S. and Minnesota counties with the highest degree of income inequality also have the highest poverty rates and the lowest median incomes, thereby underscoring the devastating impact of income inequality on low- and middle-income families.
The ACS compiles income data and computes Gini coefficients for states and counties. The Gini coefficient is used to measure income inequality; while in theory the value of a Gini coefficient can range from zero (denoting perfect equality, where all incomes are the same) to 1.0 (denoting maximal inequality, where one household has all income and all others have no income), in practice, Gini coefficient values fall within a much smaller range. For large populations—an entire state or county—Gini coefficient values generally fall within a range from about 0.35 to 0.55. This fact, however, does not indicate that income inequality is minimal; a rather small difference in Gini coefficient value can indicate a significant difference in income inequality. By the same token, a small change in the Gini coefficient value over time can denote a significant change in inequality.
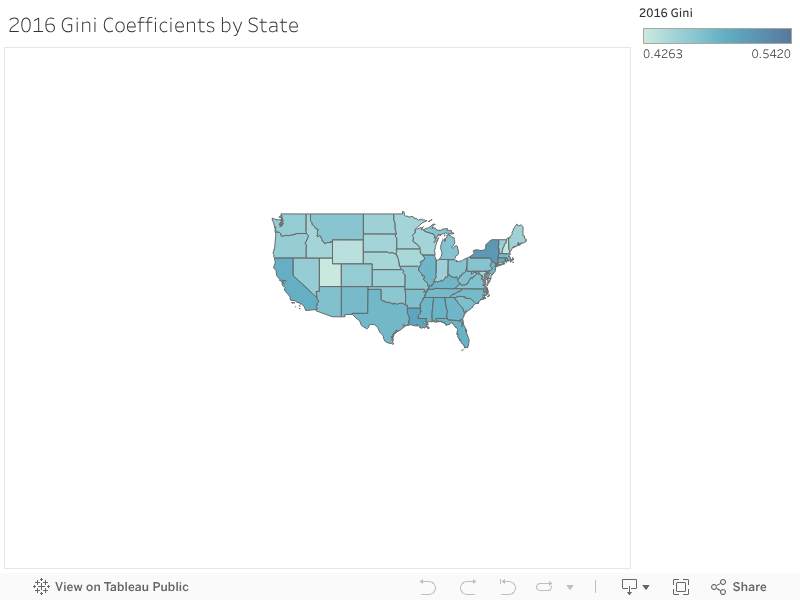
Minnesota has less income inequality than most other states, based on 2016 ACS Gini coefficients. Only eight states have lower Gini coefficients than Minnesota, meaning that Minnesota is the ninth least “unequal” state in the nation.* The map below shows the degree of income inequality by state, with the least unequal state shaded light blue and the most unequal shaded dark blue. (Alaska and Hawaii do not appear on this may. For Alaska, the 2016 estimated Gini coefficient is 0.4081, estimated 2016 median income is $76,440, and estimated 2016 poverty rate is 9.9 percent; for Hawaii, the estimated 2016 Gini coefficient is 0.4420, the 2016 estimated median income is $74,511, and the estimated 2016 poverty rate is 9.3 percent.)
var divElement = document.getElementById(‘viz1508970467947’); var vizElement = divElement.getElementsByTagName(‘object’)[0]; vizElement.style.width=’100%’;vizElement.style.height=(divElement.offsetWidth*0.75)+’px’; var scriptElement = document.createElement(‘script’); scriptElement.src = ‘https://public.tableau.com/javascripts/api/viz_v1.js’; vizElement.parentNode.insertBefore(scriptElement, vizElement);
Both in Minnesota and nationally, Gini coefficients have increased over the last ten years based on ACS estimates, denoting an increase in income inequality. This is a continuation of a trend extending over the last several decades. Even if we consider the margin of error in ACS estimates, income inequality, as measured by state and national Gini coefficients, has increased.

Minnesota’s ranking among states in terms of income inequality has improved slightly over the last ten years, going from the twelfth least “unequal” state to the ninth. Nonetheless, income inequality in Minnesota and all other states, except Alaska, has increased over the last ten years, based on ACS Gini coefficients.
Based on statewide data, there is a tendency for poverty rates to increase and median incomes to decrease as income inequality increases, although this relationship is not particularly strong, with notable deviations from the predominant trend. For example, despite the fact that New York has the highest degree of income inequality among the fifty states, it has a median income that is well above the national average and a poverty rate that is only slightly above the national average.
Statewide data, however, conceals important variation among the diverse communities within each state. Using five-year ACS estimates,† it is possible to examine the relationship between income inequality, as measured by the Gini coefficient, and (1) the poverty rate (i.e., the percentage of the population living below the poverty line) and (2) median household income for all counties in Minnesota and the United States. The more granular county-level data reveals a strong relationship between income inequality, on the one hand, and higher poverty and lower median incomes on the other. Both in Minnesota and nationally, this relationship is statistically significant at the 0.01 level; in other words, there is a 99 percent likelihood that this relationship is real and not due to random chance.
Of course, when examining characteristics of a large population such as all U.S. counties (of which there are over 3,100), it is possible that small differences will produce a finding of statistical significance. A deeper dive into the numbers, however, reveals that the difference in median incomes and poverty rates between the counties with the most and least income inequality is quite large. If we divide counties into two halves—those with the most income inequality and those with the least—the difference in income levels and poverty rates is notable. In this analysis, average incomes and poverty rates are based on the average of the median values for each county.‡

Among counties with the least income inequality, the average income is $7,600 (17.7 percent) greater and average poverty rates are 6.0 percent (nearly one-third) less than in counties with the most income inequality.
Some conservatives have argued that the existence of extreme income inequality does not necessary mean that working families are doing less well. The findings presented here undermine this assertion. Poverty rates are highest and median incomes are lowest in those parts of Minnesota and the nation with the greatest degree of income inequality. These findings are not surprising, insofar as income inequality—combined with the associated problem of wage stagnation and decline—hurts working families by reducing consumer purchasing and retarding economic growth and job creation. To add insult to injury, the degree of income inequality has increased over time.
*Minnesota’s ranking in terms of the degree of income inequality could be somewhat higher or lower than this due to the margin of error in ACS estimates. The ranking of ninth is the single most likely rank for Minnesota.
†The ACS does not compile one-year Gini coefficient estimates for all U.S. and Minnesota counties because the sample-size for many counties is too small to produce reliable single year estimates. For smaller geographical units, several years of data are pooled together in order to yield a sufficiently large sample from which reliable estimates can be drawn. In order to get Gini coefficient, poverty rate, and median income information for all U.S. and Minnesota counties, it is necessary to use ACS five-year estimates. The five-year estimates used here were derived from the 2011 to 2015 period and are the most current five-year estimates available. As with all ACS estimates, it is important to note that there is a margin of error that tends to be larger for smaller geographical units.
‡In calculating the average of the poverty rates and median income levels, counties are not weighted based upon size.