Introduction
Affordability seems to be the topic on everyone’s mind in 2026. A majority of Minnesotans now say affordability should be the top priority for elected officials, and it’s easy to see why: the cost of basics, including housing, food, child care, transportation, and health care, has surged in the past year, leaving families across the state working harder just to stay in place.
When he was elected in 2024, President Trump and the Republican Party promised to deliver affordability to people across the country. North Star Policy Action’s new Affordability Tracker is designed to dig into the data to test that claim for Minnesotans. We compare the state’s record under the first year of the Trump administration to the period that came before it, county by county and year by year.
Here’s what we found:
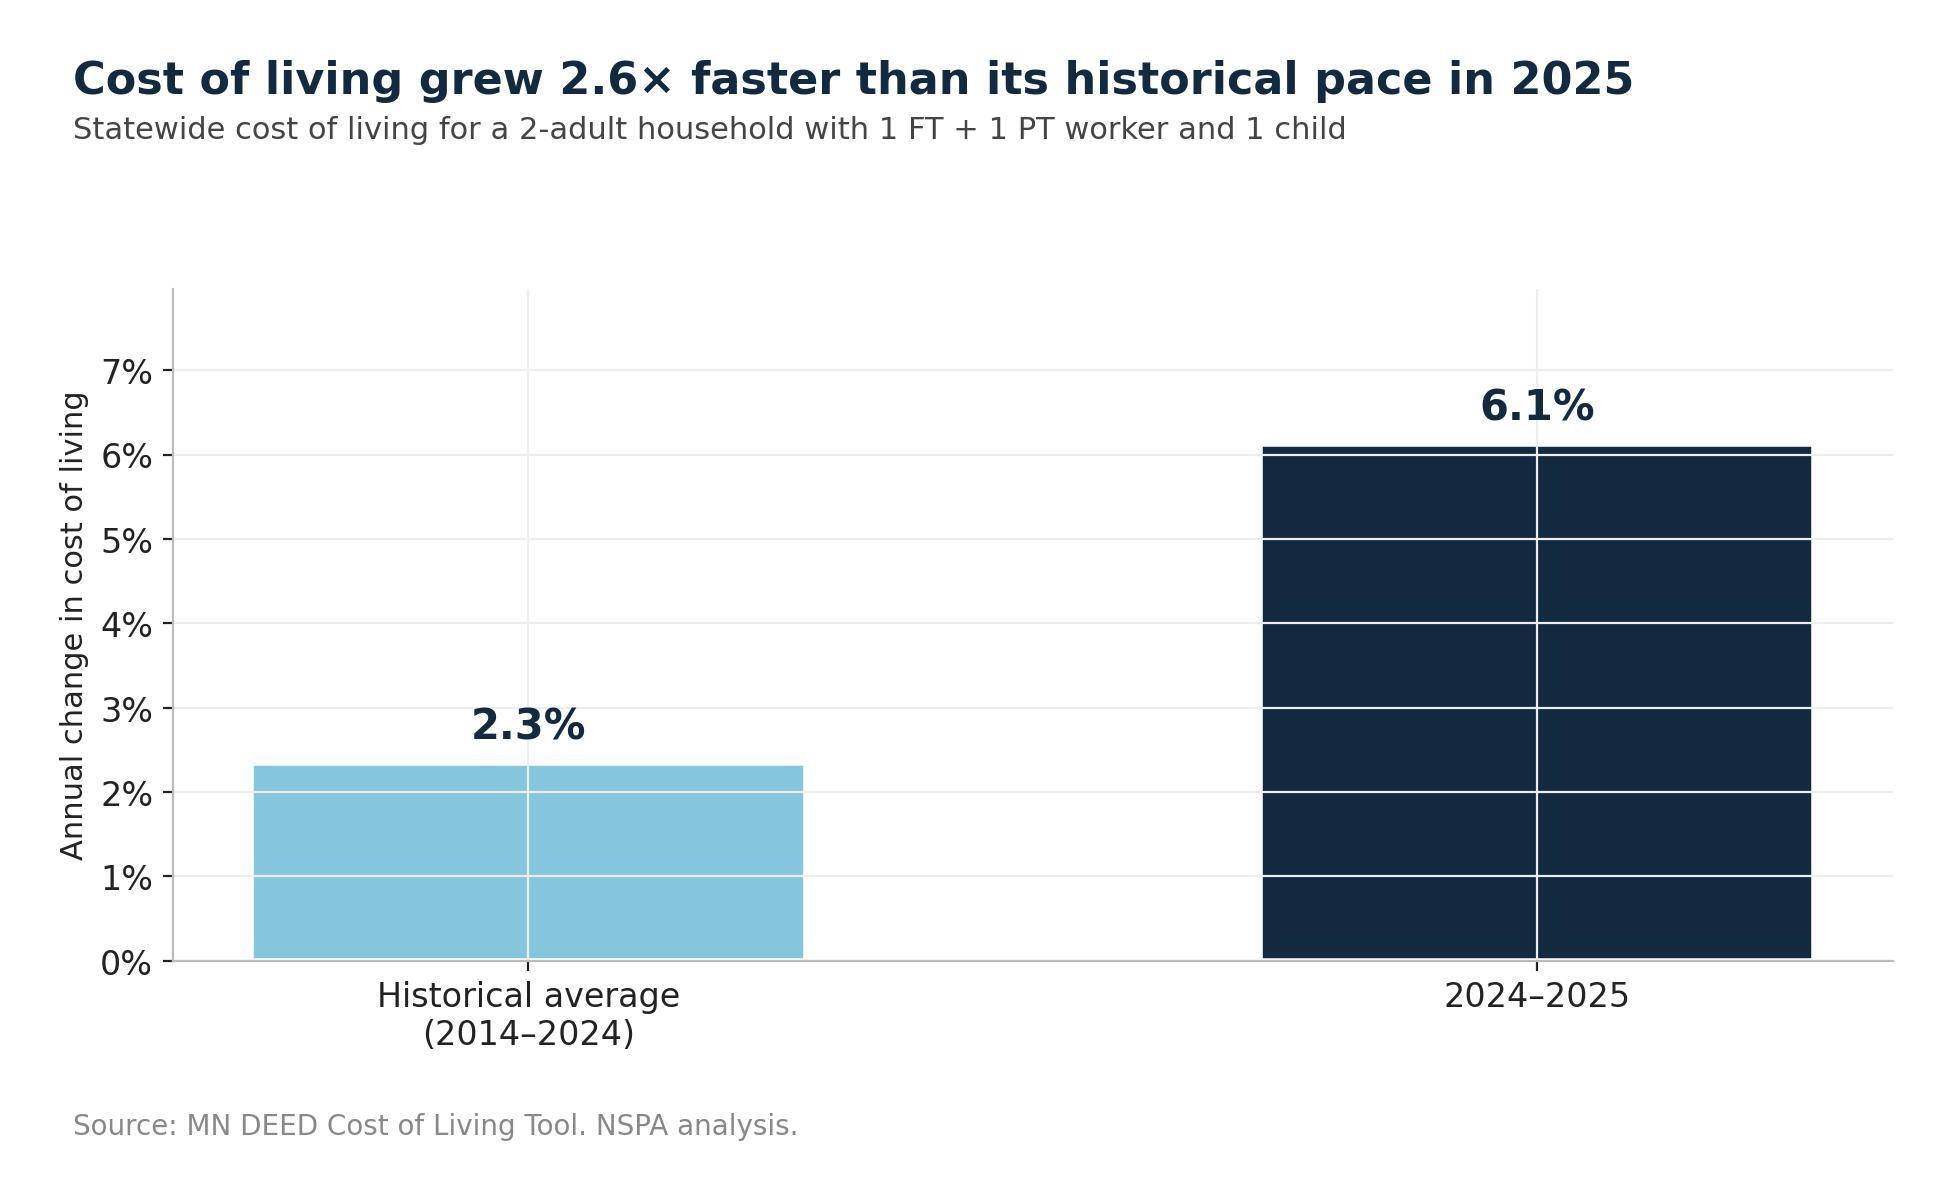
- The cost of living for a typical Minnesota family increased by 6.1% in 2025. That’s more than 2.5 times the average annual change of the previous 10 years (2.3%). If the cost of living in 2025 had followed its 10-year trend, the cost of basic needs for Minnesotans would have been $4.6 billion less last year.
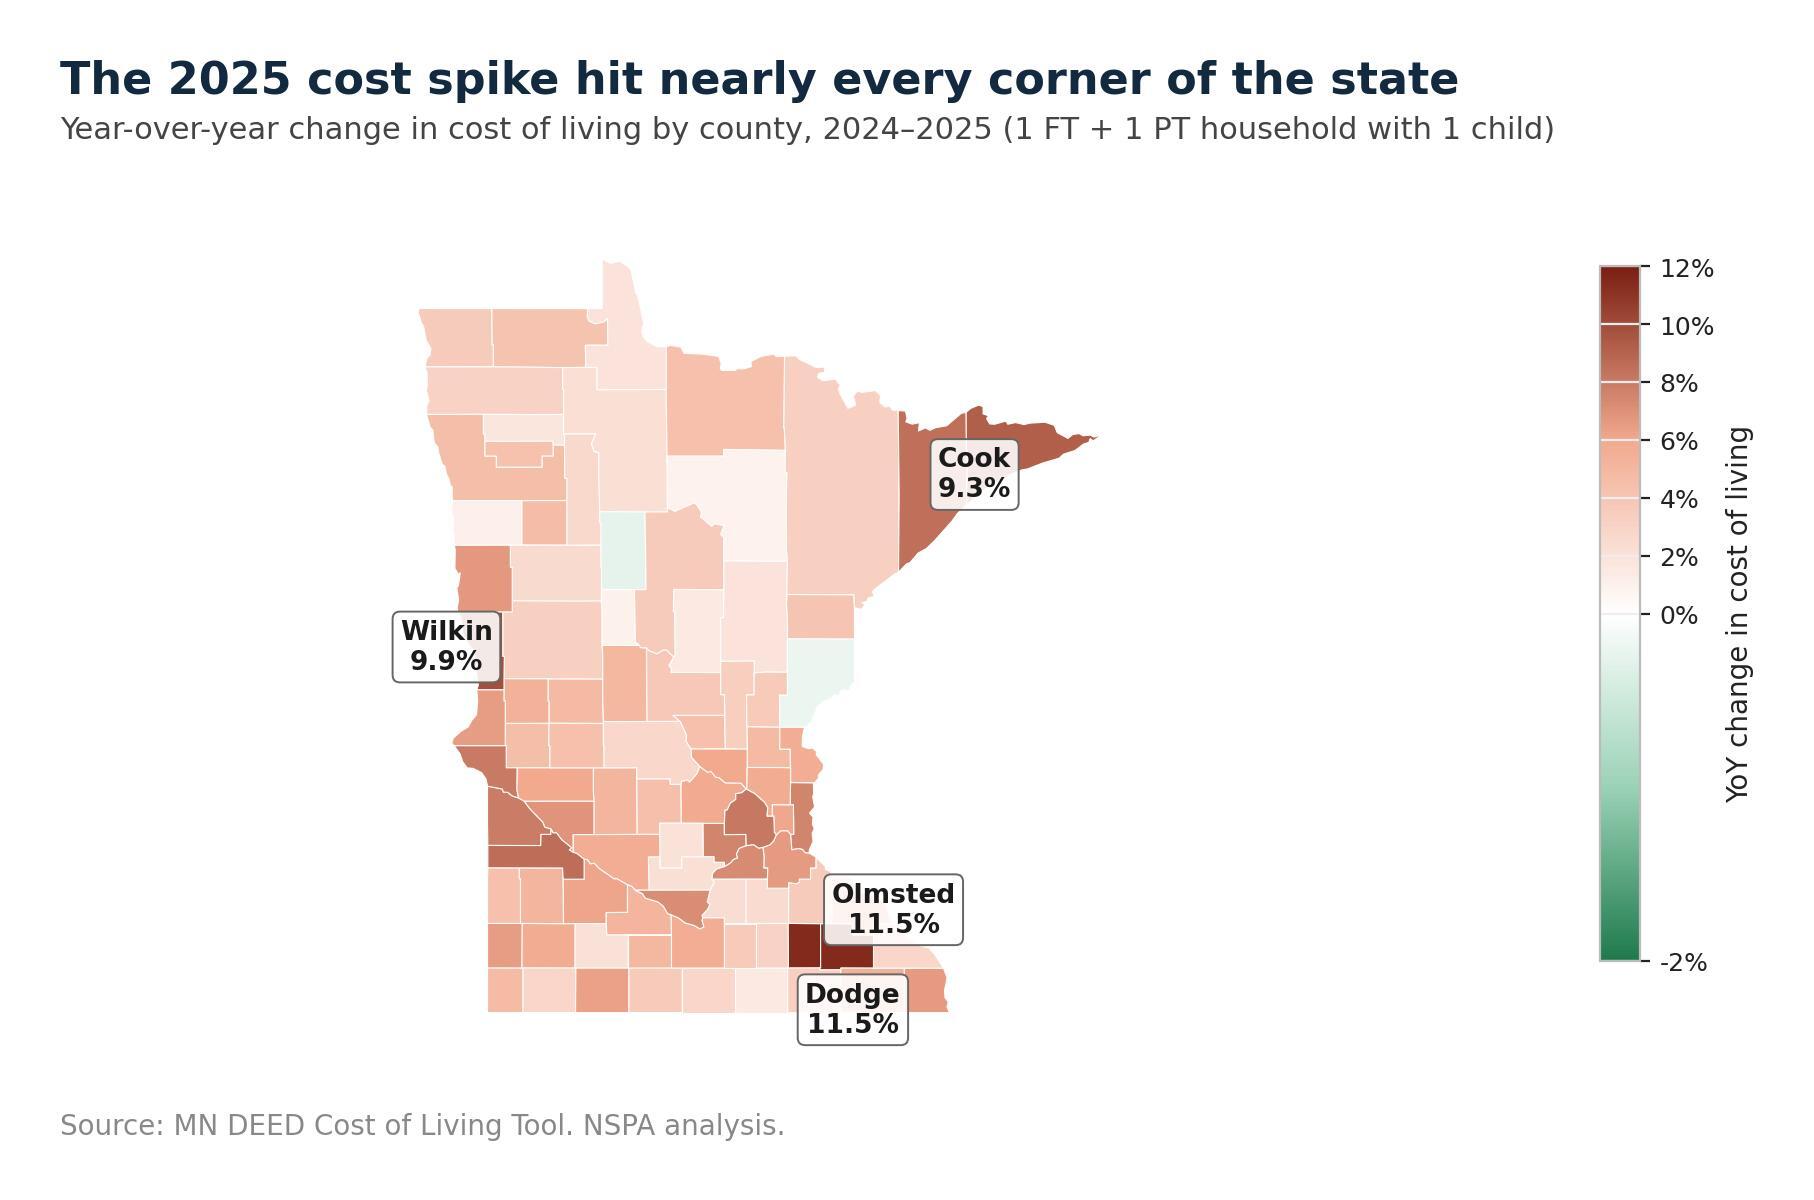
- Spikes in the cost of living touched every corner of the state. Eight-in-ten counties saw basic costs grow faster in 2025 than they had averaged over the previous decade, with four counties seeing costs rise more than 9% last year.
- Gas prices in Minnesota have already skyrocketed in 2026, rising 48% since the start of the Iran War. The average Minnesota household is projected to spend nearly $2,000 more in 2026 because of expenses related to the war.
- Costs outpaced wage growth in 2025, meaning that the median Minnesota family saw their purchasing power reduced by $1,410 in 2025.
The story that emerges from the data is not one of progress on affordability. It’s the opposite: a single year in which the basic cost of living in Minnesota broke from its long-run trend, and household incomes failed to keep up. Far from surprising, this finding demonstrates the inevitable outcome of multiple policies, ranging from tariffs to health care cuts to foreign wars, that seem designed to drive up costs for working families.
In addition, Minnesotans continue to be harmed by federal policies that fuel corporate greed, allowing productivity gains to stay concentrated in the hands of billionaire CEOs instead of bolstering workers’ paychecks. Working Minnesotans need elected officials that will deal with both sides of this equation: addressing higher costs and boosting stagnant wages to make it easier for people in the North Star State to flourish.
The Cost of Living
State-level Analysis
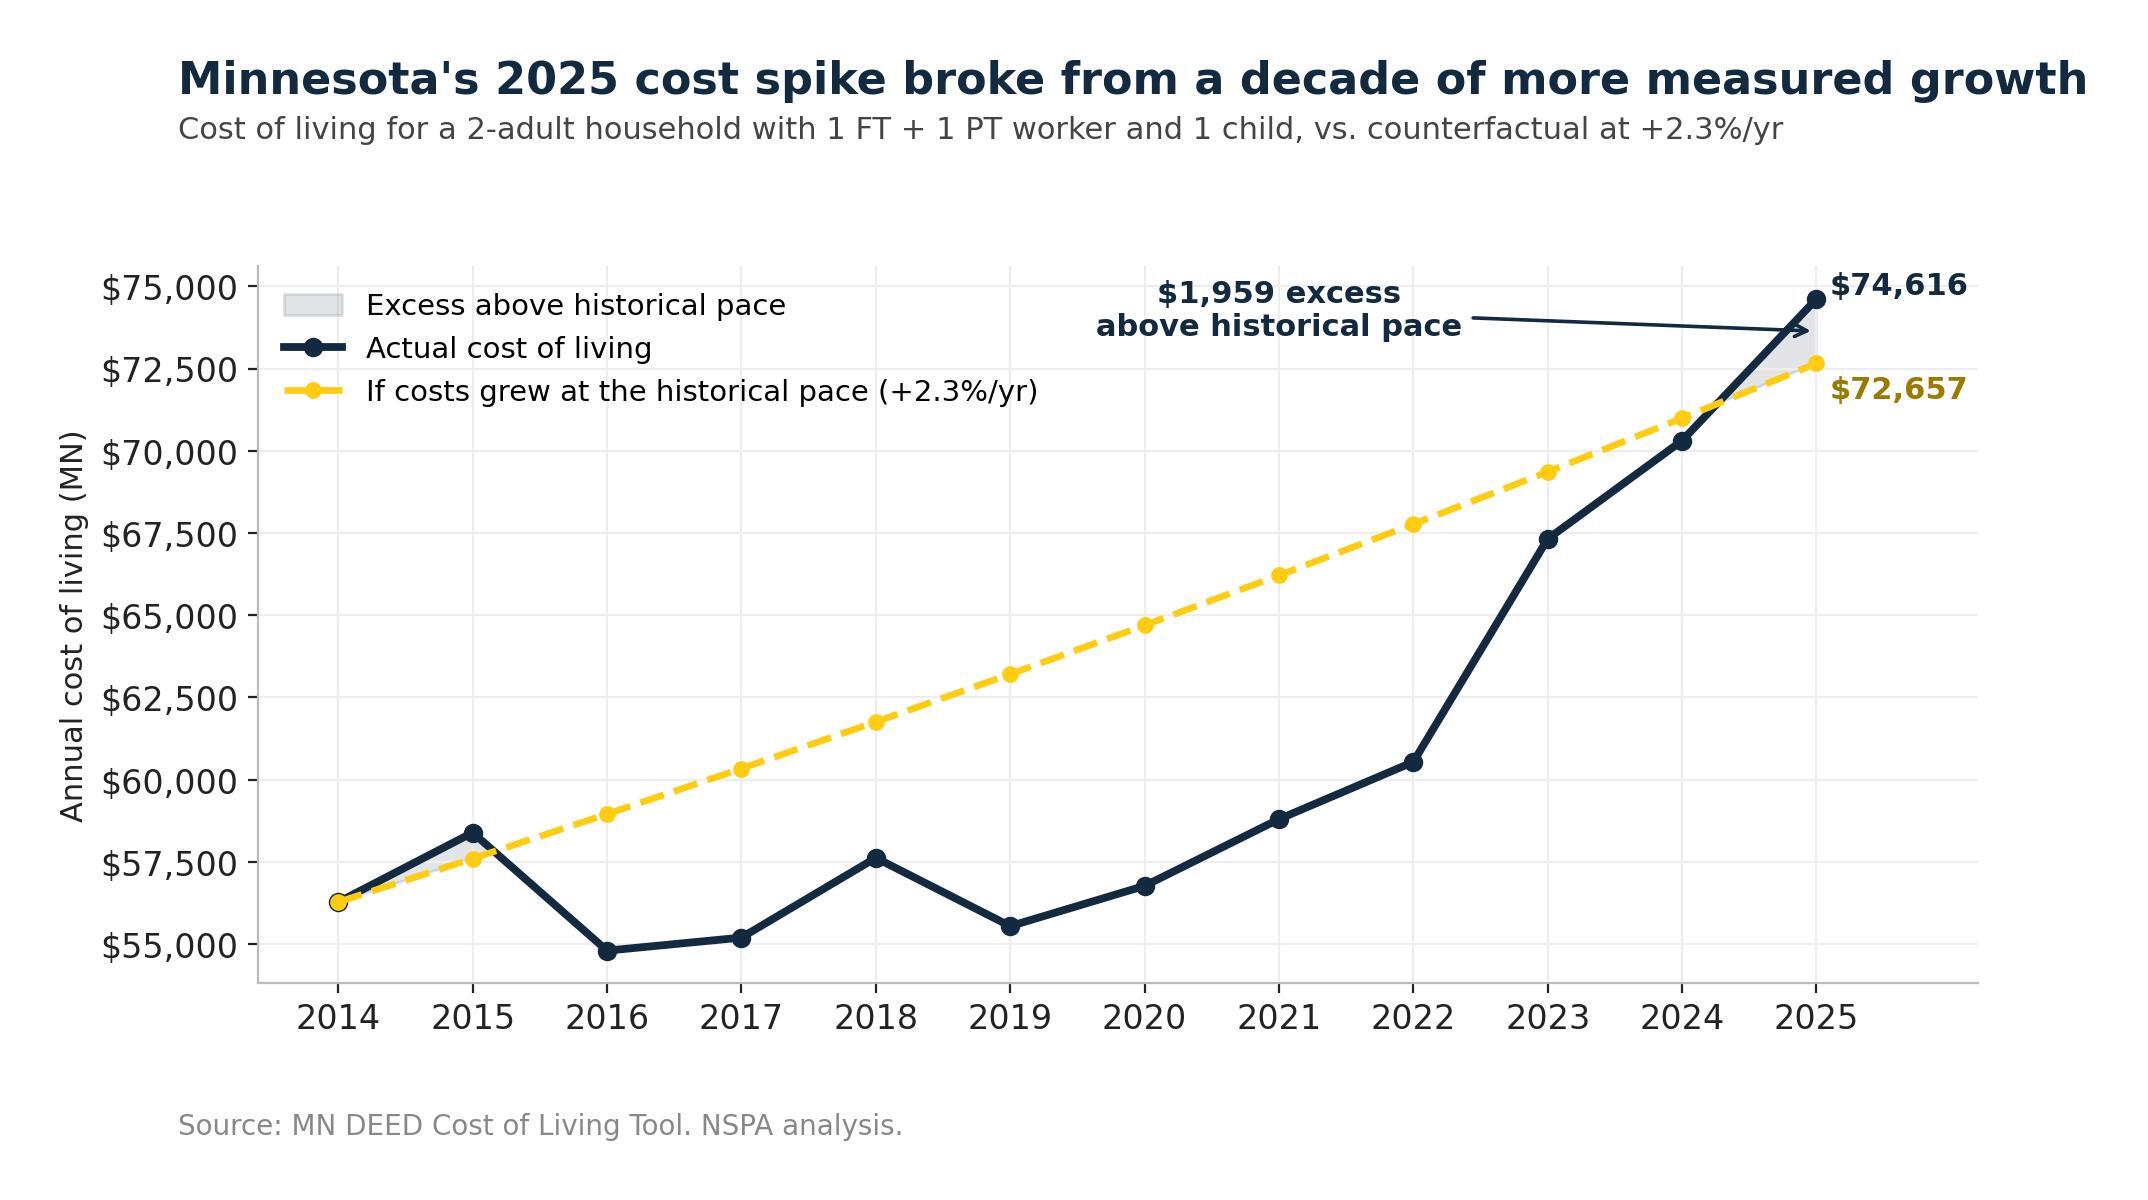
According to data from the Minnesota Department of Employment and Economic Development (DEED), the basic cost of living in Minnesota for a typical Minnesota family in 2025 was $74,616.¹ That represents a 6.1% increase from DEED’s basic cost of living figure in 2024, a jump that is nearly three times greater than the average annual increase from 2014 to 2024 (2.3%).
That kind of single-year jump is unusual in the historical record. If the cost of living had followed its long-run pattern, the typical Minnesota household would have spent $1,959 less on basic needs than it did in 2025. If we apply that extra $1,959 per household across Minnesota’s 2.35 million households, the 2025 deviation from historic norms represents an estimated $4.6 billion in additional basic-needs spending in 2025 alone.
Digging into DEED’s cost-of-living data further reveals that health care was the largest driver of the 2025 spike in Minnesota. Among the components in the cost-of-living basket, health care costs grew 25.7% in 2025. And the pressure is set to keep building. Minnesota’s uninsured rate jumped from an historically low 3.8% in 2023 to 5.8% in 2025. That represents the highest uninsured rate since 2017, with roughly 116,000 more Minnesotans losing health insurance. Impending Medicaid cuts championed by the Trump administration and fellow Republicans to help pay for tax cuts for the wealthy are expected to push up to 180,000 more Minnesotans off their insurance over the next ten years. That is expected to create an additional $1 billion in annual uncompensated care for Minnesota hospitals, translating into even larger increases in the share of household income going to medical bills for Minnesota families.
While total cost-of-living data is not yet available for 2026, data does exist for one expense that many Minnesotans deal with daily: gas. In the state of Minnesota, the average gas price sits at $3.93 per gallon. While this figure is still below the national average, it reflects a 48% increase since the end of February and the start of the Iran War. By comparison, gas prices in 2024 increased only 0.6% and decreased 8.2% in 2025.
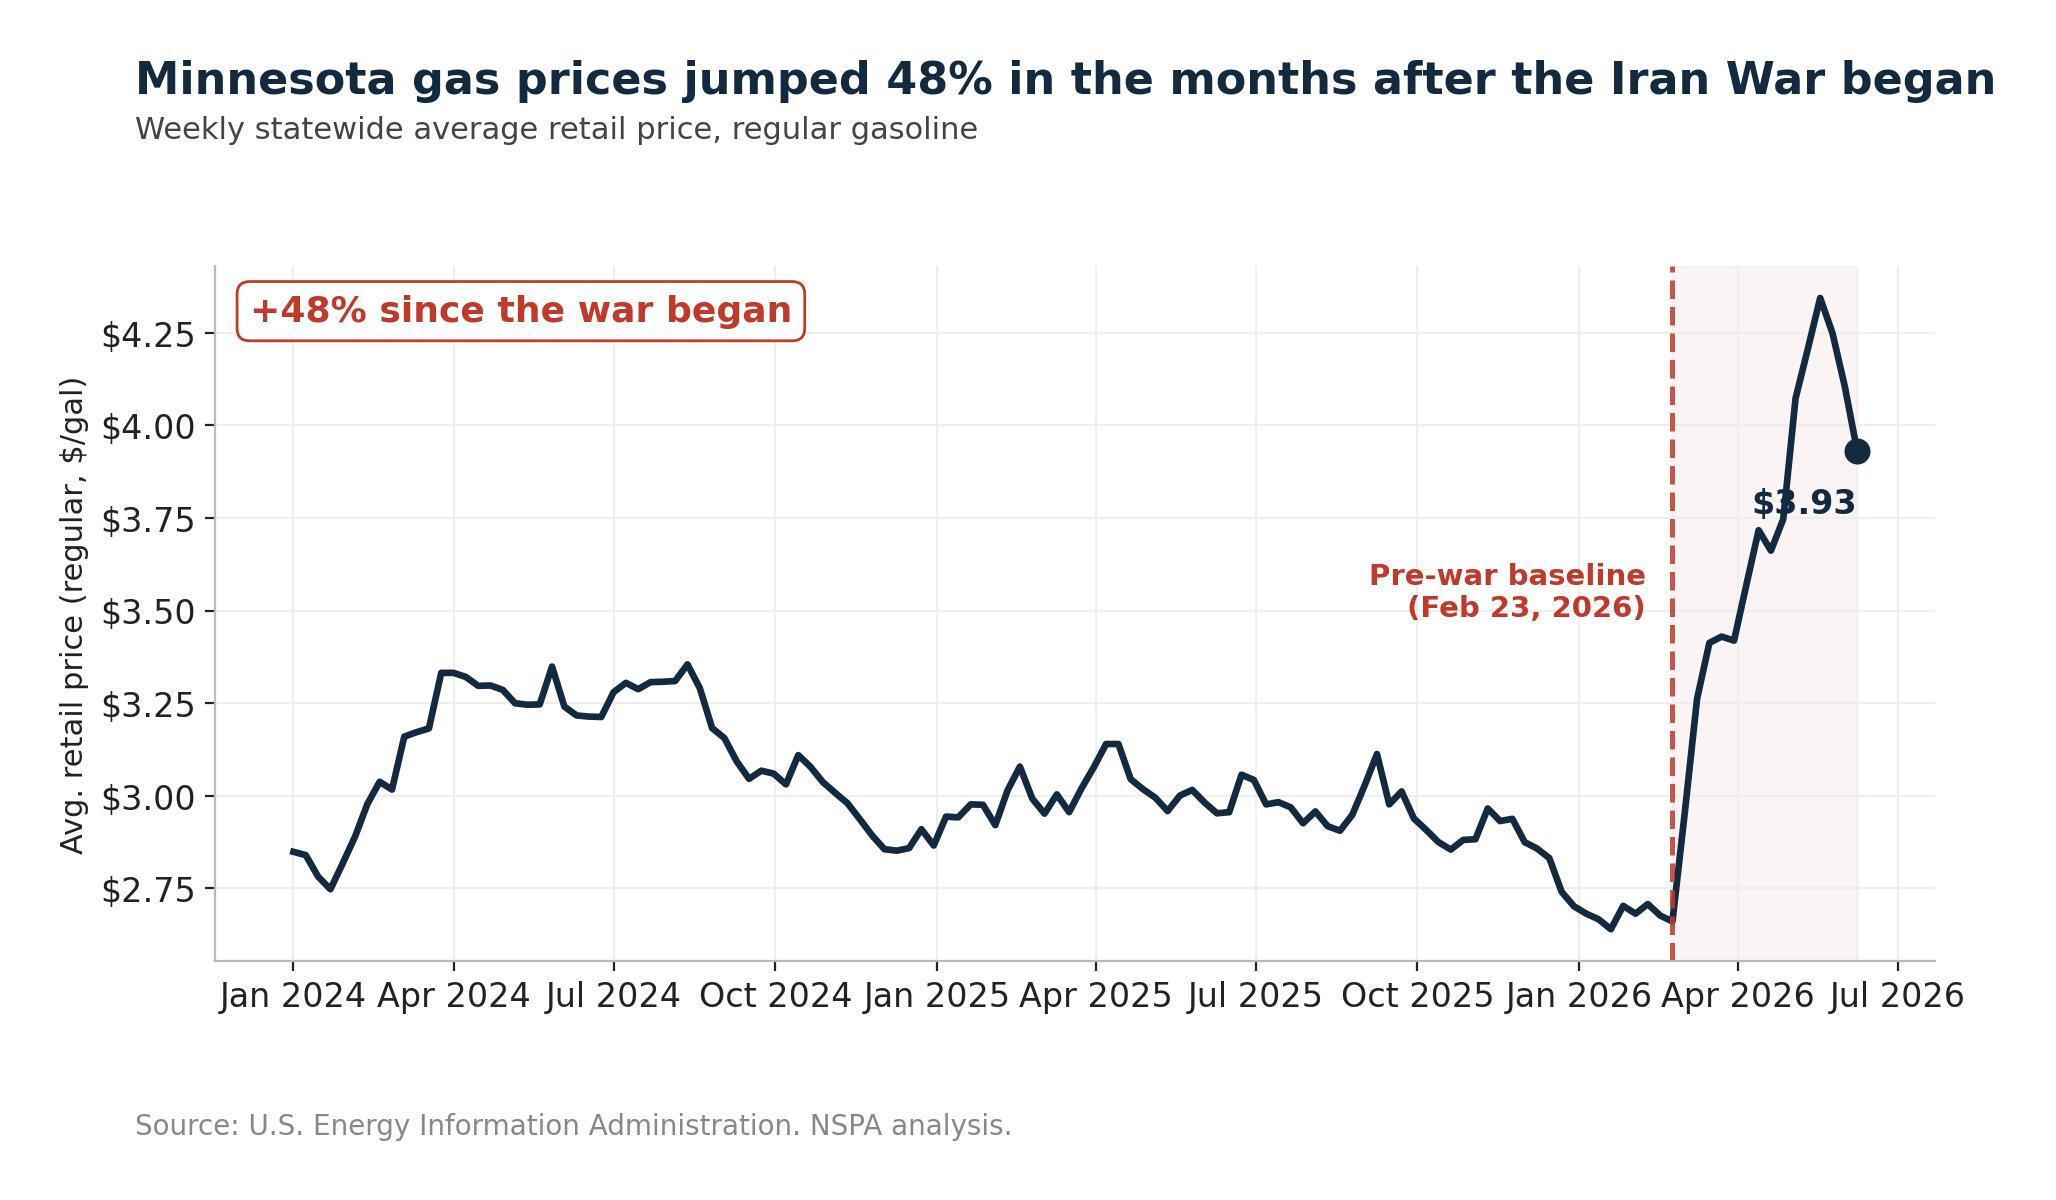
For a family of four with two drivers, this fuel cost increase and other associated expenses from the Iran War are projected to lead to $1,963.72 more being spent in 2026. As a whole, Minnesotans are projected to spend $2.6 billion in 2026 solely due to cost increases created by the war.
County-level analysis
If we move below the state level, we find that 70 of 87 counties saw a 2025 cost-of-living jump larger than their own historical average. For four of these counties, the cost of living increased by more than 9% in just one year: Dodge (11.5%), Olmsted (11.5%), Wilkin (9.9%), and Cook (9.3%). As Figure 3 shows, the spike wasn’t concentrated in any one region but reached every corner of the state.
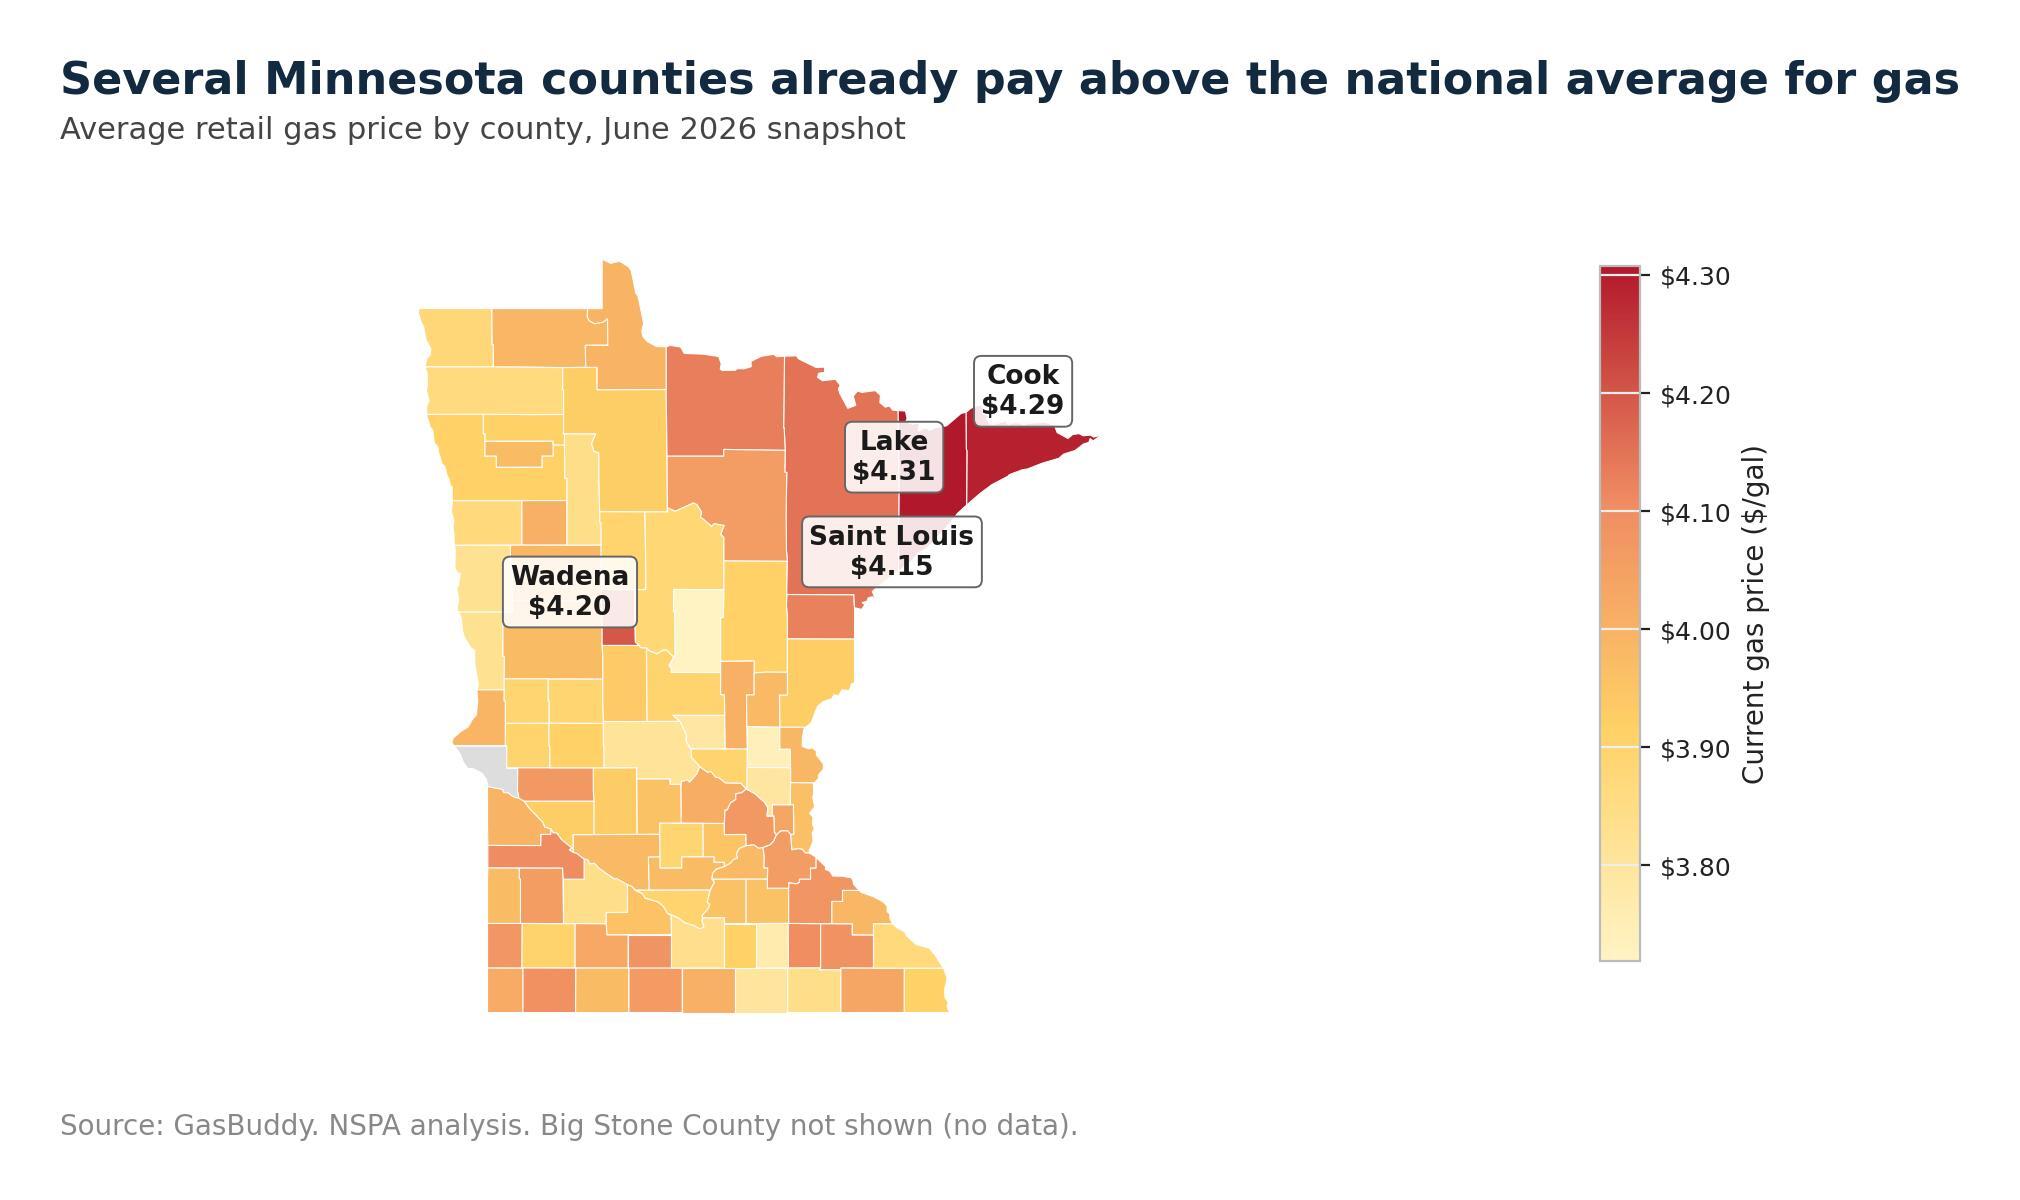
Counties are also suffering from gas price hikes. While Minnesota’s statewide gas price lags the national average, that is not true for every county, especially in Greater Minnesota. Prices in Lake ($4.31 per gallon), Cook ($4.29), and Wadena ($4.20) all outpace the nation.
The Other Side of the Affordability Equation: Income
There are two sides to affordability: the cost of living and the wages people are paid to cover that cost. We draw on median earnings data to consider both sides in our analysis. The picture for 2025 only gets worse when we put them next to each other.
Statewide
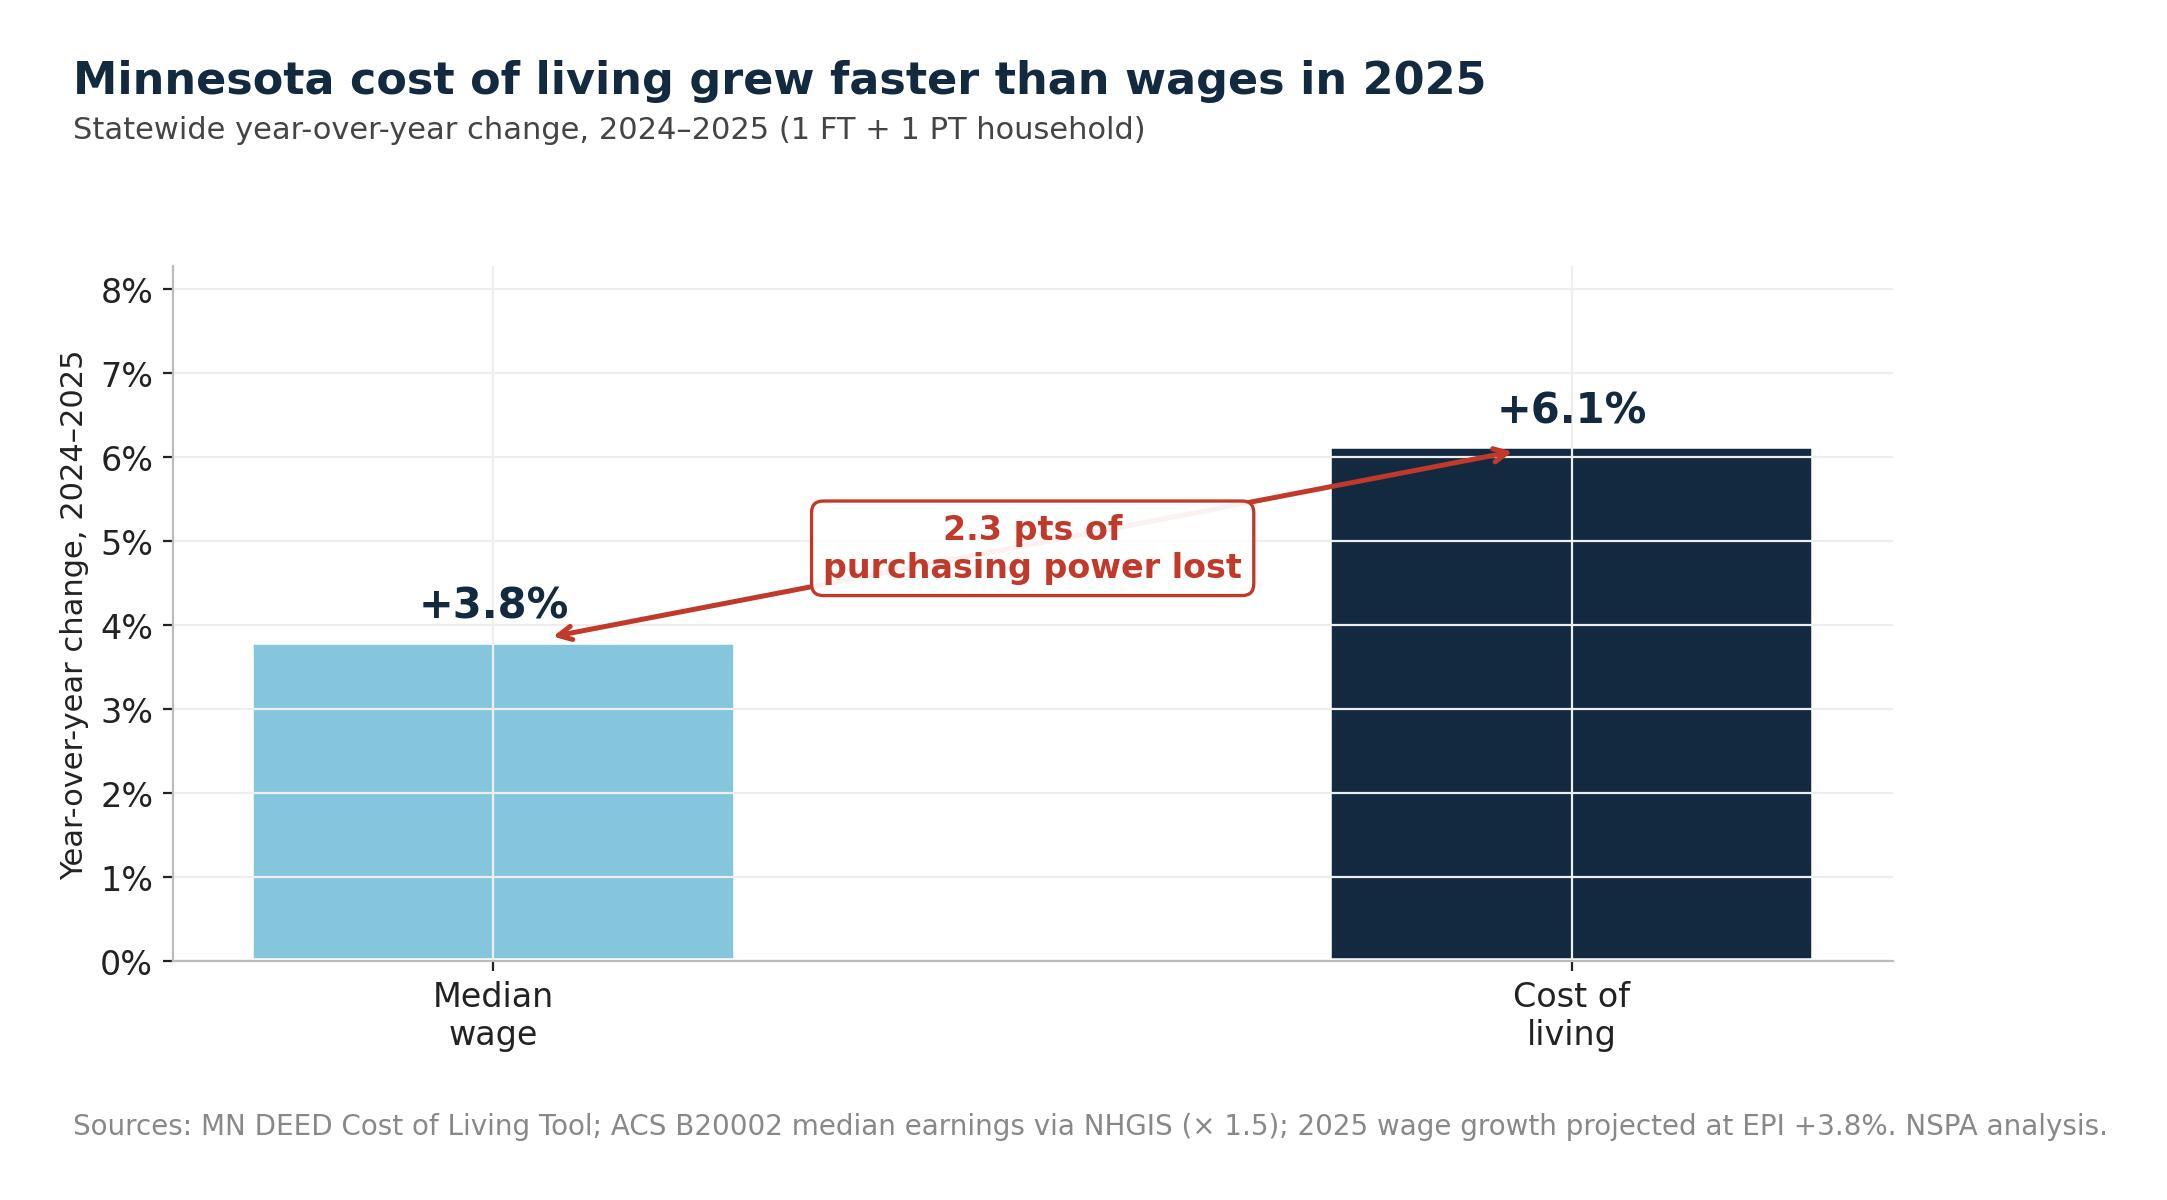
Minnesota’s median wage grew by 3.8% from 2024 to 2025. This increase must be weighed against the previously cited 6.1% growth in the cost of living in the same period. Practically, the difference between these two numbers demonstrates that the median Minnesota worker lost ground in 2025 to the tune of roughly 2.3 percentage points in purchasing power. This is the math that can help explain why Minnesota families feel worse off, even as paychecks technically grew.
Fortunately, income growth in Minnesota has been robust over the previous decade, generally growing at a greater rate than basic costs. That has created some cushion against rising costs, such that the median family in Minnesota had a nearly $6,000 surplus over the typical cost of living in 2024. Unfortunately, with costs outpacing wages in 2025, that surplus declined by more than $1,410 in 2025 (resulting in a $4,539 surplus), meaning Minnesota families lost $3.3 billion in purchasing power last year.
Notably, DEED’s cost-of-living metric is designed to capture “a living that meets basic needs for health and safety.” As such, it excludes costs for items such as savings, vacations, and entertainment. That a typical Minnesota family enjoys just a $4,500 surplus over meeting their basic needs indicates little capacity to enjoy these other aspects of life, as this averages to just over $12 per day.
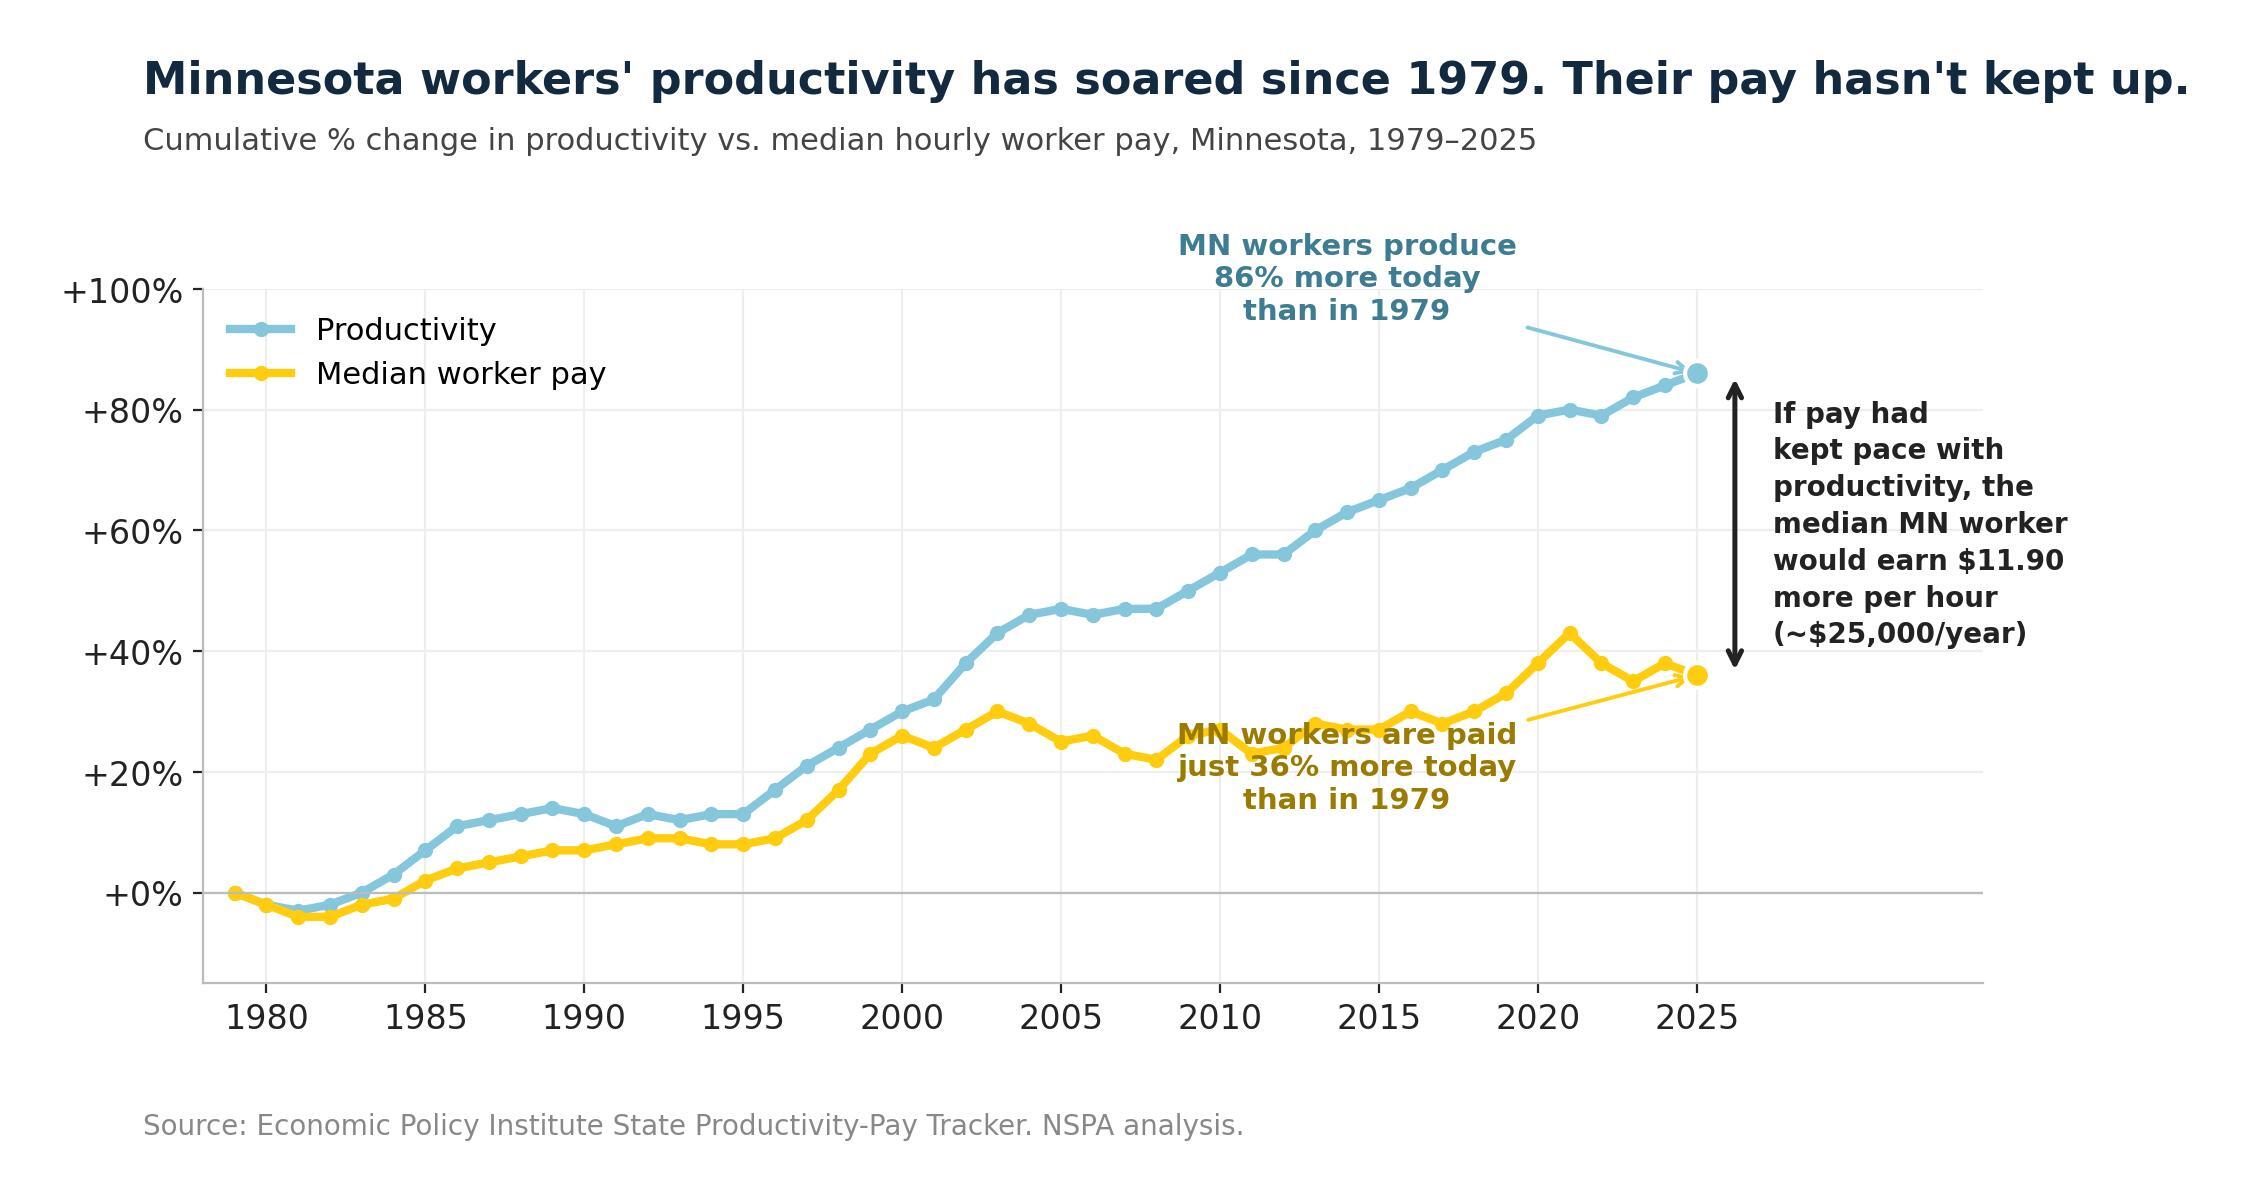
Moreover, while wage growth has been relatively strong in Minnesota, it continues to lag productivity growth, suggesting that workers are not seeing a reward for their increased output. Since 1979, worker productivity in the state has increased by 87%, while median wages grew just 36%. If wages had kept pace with productivity gains, the median worker in Minnesota would earn 37% more today, resulting in $25,000 more per year.
Over this same period, CEOs have gone from making 33 times more than their average worker in 1979 to 280 times more in 2024. Corporate profits also continue to set new records, totaling over $4.3 trillion in the first three months of 2026. Combined, these statistics provide clear evidence that the rewards of a more productive workforce are flowing to billionaires instead of the workers creating that value. From this perspective, while Minnesota needs policymakers to address the most recent federal policy blunders that have driven up costs, it also needs leaders to take on longstanding policies that have allowed corporate wealth to skyrocket with little benefit for workers.
County-level analysis
Mirroring the relatively strong financial position statewide, only 14 Minnesota counties had median incomes that fell short of the cost of living in 2025. Unfortunately, in four of these counties, the income v. cost gap was higher than $5,000. Notably, these counties span both the metro area and Greater Minnesota, including Aitkin, Pine, Ramsey, and Rice.
Conclusion
The data shows that far from addressing affordability, the problem grew substantially worse in Minnesota in 2025. Importantly, the 2025 cost jump is not merely a continuation of pre-existing pressure, but instead represents a break from the past 10 years, and points to something new happening under President Trump’s leadership.
While we don’t yet have 2026 data for all factors in the cost of living, gas prices, the recent three-year high in inflation, and Minnesota’s nation-leading rate of farm bankruptcies suggest things are getting more difficult for working Minnesotans, not easier. Health care costs are set to keep climbing as Minnesota’s uninsured rate rises due to Republican cuts. Gas prices driven by the Iran War are on pace to add thousands of dollars to household budgets. And wage growth isn’t keeping pace. We need leaders who are going to fight back against cost pressures coming from the federal government and make Minnesota affordable again.
Explore the data further at the Minnesota Affordability Tracker.
Methodology
Cost of living: Minnesota DEED Cost of Living Tool, 2014-2025. Benchmark household = two adults (ages 19–50), 1.5 workers (one full-time and one part-time), one child.
Income: ACS 5-year median 12-month earnings (B20002) via the National Historical GIS, 2014-2024, multiplied by 1.5 to provide an estimate for a household with one full-time and one part-time worker. The estimate for 2025 income is projected by applying EPI’s State of Working America estimate for Minnesota’s nominal median wage growth (+3.8%) to 2024 ACS values. Estimated values are flagged in the tracker.
Gas prices: EIA weekly retail gasoline series (Minnesota, regular all formulations) for the time-series figure. The Iran War household impact projection comes from the Institute on Taxation and Economic Policy (ITEP).
Statewide aggregate: Per-household excess above the historical-trend projection ($1,959) multiplied by the approximate number of Minnesota households (2.35 million, Minnesota State Demographic Center). This is a rough order-of-magnitude figure since the DEED benchmark reflects a three-person family and thus does not represent all households.
Endnotes:
- According to the DEED’s methodology, a typical Minnesota family is comprised of one full-time working adult, one part-time working adult, and one child. More detail can be found on DEED’s Cost of Living methodology page.