Minnesota’s population has increased by 2.5 million people (85 percent) since the middle of last century, but the rate of that growth has been unevenly spread geographically and over time. The following analysis provides a description of Minnesota’s population change since 1950, focusing on the amount of the change and where it has occurred. The following analysis is a simple numerical examination of where population in the state has grown and where it has not, not an in depth exploration of the many and varied reasons for these growth patterns. While some of the state’s population trends—such the more rapid increase in the metropolitan area relative to Greater Minnesota—have long been known, the magnitude and changing nature of these trends over time is often not fully appreciated.
This analysis will be based on population information from the last seven decennial censuses (from 1950 to 2010) and annual population estimates from the Minnesota State Demographic Center and the U.S. Census Bureau for 2011 to 2016.* For purposes of this analysis, the 87 Minnesota counties will be grouped into three groups: (1) the seven-county metropolitan area (comprised of Anoka, Carver, Dakota, Hennepin, Ramsey, Scott, and Washington); (2) nine “collar” counties immediately adjacent to the seven metro counties (Chisago, Goodhue, Isanti, Le Sueur, McLeod, Rice, Sherburne, Sibley, and Wright); and (3) the 71 remaining counties, referred to here as “Greater Minnesota counties.”†
The rate of state population growth has fluctuated somewhat since 1950. Minnesota experienced the most rapid rate of statewide population growth during the 1950s. The state’s average annual population growth exceeded one percent during the 1950s, 1960s, and the 1990s; it was less than one percent during the 1970s, 1980s, and 2000s. Estimated average annual state population growth from 2010 to 2016 was 0.7 percent.

Throughout this entire 66-year period, Minnesota’s average annual rate of population growth lagged behind the national average, but the rate of population growth in Minnesota has consistently surpassed the Midwest average,‡ with the exception of the 1950s. Minnesota’s population growth relative to the rest of the Midwest has been particularly robust since 1970. Since 2010, the estimated average annual percent growth in Minnesota’s population has been more than double the Midwest average.
The growth in Minnesota’s population since 1950 has not been evenly distributed across the state.

Of the estimated 2.55 million increase in the state’s population from 1950 to 2016, 1.86 million—73 percent of total statewide growth over this 66-year span—occurred within the seven-county metropolitan area (henceforth referred to as the “metro area”). The remainder of the growth was somewhat evenly divided between the collar counties (0.32 million) and Greater Minnesota counties (0.37 million).
As a result of the uneven regional population growth since 1950, the distribution of the state’s population has shifted considerably over time. Just under 40 percent of the state’s population resided in the metro area in 1950; by 2016, a 55 percent majority resided in the metro area. The collar county share of the statewide population increased from six percent in 1950 to nine percent in 2016, while the share in the remaining 71 counties of Greater Minnesota fell from 54 to 36 percent.

Of course, there has been considerable variation within each of these three broad regions in terms of population growth since 1950. Some counties in Greater Minnesota outside of the collar counties have seen robust growth; for example, the population of Olmsted County more than tripled over this 76-year span, while the populations of Benton and Clay counties more than doubled. In 37 Greater Minnesota counties, however, the population has declined since 1950. The largest percentage decline occurred in Traverse County, which saw a 58 percent population drop—one of three Greater Minnesota counties that lost over half of its population from 1950 to 2016.
Except for Sibley County—which lies just outside the southwest corner of the metro area—the population of each metro and collar county increased since 1950. The population in five of the seven metro counties and four of the nine collar counties more than doubled. Anoka County experienced nearly a tenfold increase in population from 1950 to 2016, while the population of five other metro and collar counties increased by over fivefold.
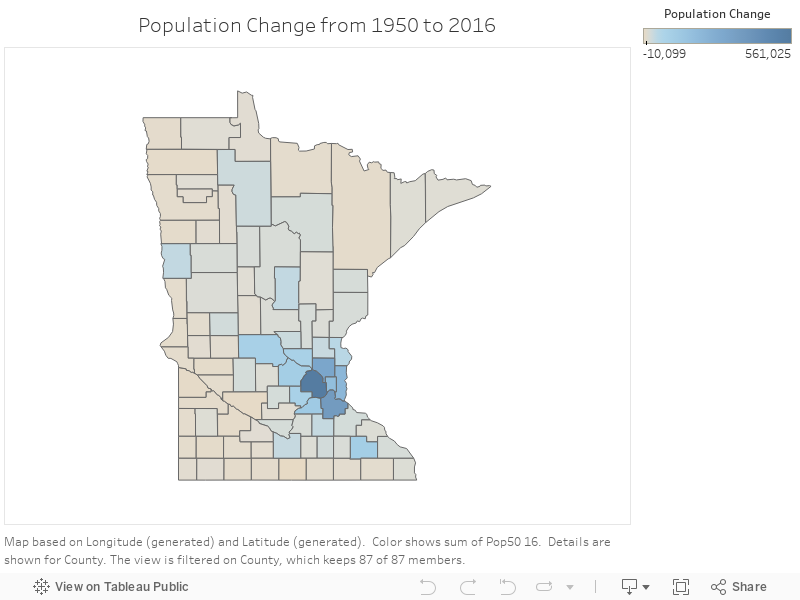
It is important to remember that some counties with remarkable percentage increases in their population from 1950 to 2016 had a very small population in 1950. Thus, substantial percentage increases in the population of these small counties does not necessarily contribute much to the overall growth in the total state population over the last six and a half decades. While Hennepin County ranked 17th among counties in percentage population growth from 1950 to 2016 (82.9 percent), it had the largest numerical increase in population over this period. The 561,000 population increase in Hennepin County constituted 22 percent of the total statewide population increase.
The following map shows the numerical increase in the county population from 1950 to 2016.
var divElement = document.getElementById(‘viz1504190177103’); var vizElement = divElement.getElementsByTagName(‘object’)[0]; vizElement.style.width=’100%’;vizElement.style.height=(divElement.offsetWidth*0.75)+’px’; var scriptElement = document.createElement(‘script’); scriptElement.src = ‘https://public.tableau.com/javascripts/api/viz_v1.js’; vizElement.parentNode.insertBefore(scriptElement, vizElement);
In addition to Hennepin, six other counties had populations that increased more than 100,000: Anoka (313,000), Dakota (369,000), Olmsted (105,000), Ramsey (185,000), Scott (126,000), and Washington (219,000). With an increase of 86,000, Carver is the only metro county with a population increase under 100,000 over this period. Thirteen counties—all in Greater Minnesota—lost over 5,000 people from 1950 to 2016. The largest population decline occurred in Faribault County, which lost just over 10,000 people.
The decennial census counts allow us to examine the population change over this period at ten year increments. The seven-county metro area showed robust population growth during each decennial census from 1950 to 2010. From 1950 to 1960, the percentage increase in the collar county population was only slightly greater than that of the Greater Minnesota counties. As metro population growth began to spill over into exurban areas, collar county population growth began to accelerate in the 1960s relative to Greater Minnesota. From 1990 to 2010, the percentage growth in collar county population surpassed that of the metro area.

After 1960, population growth in Greater Minnesota lagged substantially behind the rest of the state. The population in this region actually declined from 1980 to 1990, no doubt driven in large part by the farm crisis of the 1980s. During this decade, the population in two-thirds of Greater Minnesota counties declined. The lag in population growth in this region relative to the rest of the state would have been even more pronounced, but for the significant population growth that occurred in Olmsted and Stearns counties.
While collar counties enjoyed the largest percentage growth in population from 1950 to 2010, the vast majority of the overall population growth occurred in the metro area. With the exception of a modest slowdown during the 1970s, the population of the metro area increased at a fairly steady rate throughout this period. While the percentage growth among Greater Minnesota counties was about one-eighth the growth rate of collar counties, Greater Minnesota counties contributed slightly more than collar counties to overall state population growth over this sixty-year span.

Population growth patterns have shifted somewhat since 2010, based on annual population estimates from the State Demographer. While the pace of population growth in the metro area has accelerated since 2010 relative to the preceding decade (i.e., 2000 to 2010), the rate of population growth in the rest of the state has slowed. Average annual population growth from 2010 to 2016 in all seven metro counties exceeded the statewide average (0.7 percent).

Average annual average population growth from 2010 to 2016 fell short of the statewide average in all but two of the collar counties (Sherburne and Wright), and actually declined in three (Le Sueur, McLeod, and Sibley). Population growth among all 71 Greater Minnesota counties was below the statewide average, except for Blue Earth, Clay, and Olmsted counties; population declined from 2010 to 2016 in 42 of these 71 counties.
Over 85 percent of total the estimated 225,000 state population growth from 2010 to 2016 occurred in the metro area, with 38 percent of this growth occurring in Hennepin County alone. The remainder of the state population growth over this period was fairly evenly divided between the collar counties (7.0 percent of total state population growth) and Greater Minnesota counties (7.6 percent).

The rate of growth in collar county population has subsided in recent years, while seven-county metro population growth continues unabated. Population growth in Greater Minnesota has lagged behind statewide and metro growth throughout the entire period since 1950. This trend is almost certainly due in part to the mechanization of the agricultural industry and concentration of farm land ownership, which has translated into a need for a smaller agricultural workforce.
The use of county-level data masks some interesting population trends that have occurred within Minnesota counties. Two of these trends will be explored in the next article in this series.
*Population data for 2011 to 2016 used for purposes of comparing Minnesota population growth to the rest of the nation and Midwest are based on U.S. Census Bureau estimates. The Minnesota population information (including all county-specific data) used elsewhere in this article is based on annual estimates from the State Demographic Center. Estimated average annual Minnesota population growth from 2010 to 2016 is 0.7 percent under both the State Demographer and U.S. Census Bureau estimates.
†“Greater Minnesota” typically refers to the 80 counties outside of the seven-county metro area; in this article, “Greater Minnesota” will refer only to the 71 counties, excluding the seven metro and nine collar counties.
‡The twelve states of the Midwest as defined by the U.S. Census Bureau are Illinois, Indiana, Iowa, Kansas, Michigan, Minnesota, Missouri, Nebraska, North Dakota, Ohio, South Dakota, and Wisconsin.