Earlier this year, conservatives attempted to repeal the Affordable Care Act (ACA) and replace it with the American Health Care Act (AHCA), otherwise known as Trumpcare. These efforts were stymied by the rivaling factions within the Republican party, but had the bill passed, it would have devastated older working and middle class Minnesotans. Although momentum for repealing and replacing the ACA has slowed in recent weeks, it is still important to examine how the AHCA – conservatives’ big idea for health care reform – would impact Minnesotans across the state. We can see that the premium net losses for tax credits drastically harm Minnesotans in most zip codes, while only modestly aiding higher-income Minnesotans. The communities most affected are in Greater Minnesota, while communities in the Twin Cities metro area are less affected.
This mirrors the work done by Richie Bernardo at WalletHub, who looked at the impact on premium subsidies in various cities across the country. Assuming a two person, median-aged household earning a median income, we calculated the average expected subsidies from the ACA using the Kaiser Family Foundation’s Health Insurance Marketplace Calculator. We then compared these numbers by zip code to proposed Trumpcare subsidies, which are flat subsidies bracketed by age (e.g $3,000 for two 20-29 year olds, $4,000 for two 30-39 year olds, etc.). These subsidies would replace ACA subsidies in 2020. For more information about our methodology, see the end of this article. This article will compare the subsidies for both the ACA and the AHCA, but before examining the results, here is a quick explanation of how ACA premium subsidies work compared to AHCA premium subsides.
On the one hand, ACA subsidies are only available to those living between 138% and 400% of poverty, explicitly prioritizing working Americans above the rich. On the other hand, Trumpcare subsidies are available to individuals making as much $75,000 annually or households earning $150,000 annually. For example, a 45-year-old couple making $49,000 annually would receive a $6,000 subsidy, while a 45-year-old couple making $150,000 would also receive a $6,000 subsidy. If both couples looked for premium tax credits utilizing the ACA’s system, only the first couple would be eligible for tax credits.
The ACA also includes several provisions to help working people afford premiums through the state exchanges. First, it restricts how insurance companies could determine what a plan cost. The ACA limits how much a plan can cost by capping the amount an older person can be charged in relation to a younger person at three times the younger person’s premium. This is called an age band restriction. Second, the ACA requires insurance providers to set premiums by community rather than by individual. This provision shields sicker people from extremely high costs, and essentially prevents insurers from charging individuals for pre-existing conditions. There are nine of these communities – also called rating areas – in Minnesota, which are broken down by counties. These provisions help control the costs of monthly premiums.

Once the premium costs are determined for each rating area, the ACA determines how much of the premium is subsidized by capping the percentage of an individual’s monthly income that can go towards health care. For instance, an individual earning $24,000 (around 200% of the poverty limit) can only pay up to 6.5% of their monthly income in premiums, which is roughly $130. This monthly cap is then compared to the second-lowest silver-level plan on the exchange in her community, and the difference in premium costs for that plan and the monthly cap is the premium subsidy. For instance, if she lives in Ramsey County and is 28 years old, the benchmark silver plan costs $311 a month (according to Kaiser Family Foundation’s subsidy calculator). She is only allowed to pay $130 a month, so her subsidy would be $181 a month. That subsidy could be applied to any level plan on the exchange. If she lived in Carlton County, which is in another rating area, that plan would cost $378 a month. However, since she still is only allowed to pay $130 a month on premiums, her subsidy would increase to $248 a month. The subsidy factors in local costs, which are often more expensive in rural, lower income counties.
Trumpcare replaces this system with an age-based subsidy. Individuals are put into age brackets (people aged 20-29, 30-39, 40-49, and 50-59), and provided a flat annual subsidy ranging from $2,000 to $4,000 per person. These subsidies apply equally to any individual earning less than $75,000 annually, or joint-filers earning $150,000, according to Section 36C of the AHCA text.
The Census Bureau states that there are 885 zip codes that represent inhabited areas in Minnesota. There are an additional 67 zip codes that were not recognized by the Census, which represented PO boxes and high volume non-residential areas (such as the Wells Fargo building in Saint Paul). 18 zip codes did not have ACS data for median income, and another 7 had median ages outside of our scope (below 20 or above 64).
With the remaining 860 zip codes, we compared the premium subsidies between the ACA and AHCA. 841 of those zip codes had a numerical figure for the ACA estimate for premium subsidies. The other 19 zip codes had low enough median incomes to be eligible for MinnesotaCare or Medicaid, meaning if the ACA was replaced by Trumpcare, the “average” person in these zip codes would lose their health insurance if their employer does not provide coverage. For the rest of the zip codes, the pattern is clear, both demographically and geographically.
Those who lose the most in subsidies are older, poorer, and more likely to live in Greater Minnesota, while those who gain are younger, have higher incomes, and are more likely to live in the metropolitan area. For instance, 225 zip codes would lose at least $3,000 in subsidies if Trumpcare were implemented. The average median age of this group is 49, and the average median income is approximately $48,000 annually.
As the losses mount, the average population grows older and poorer. Zip codes losing at least $5,000 in subsidies are on average 53 years old with $46,000 annual incomes; $7,000 losses averaged 56 years and $45,500. Most worryingly, in 13 zip codes, an average couple would lose over $10,000 in subsidies, while earning only $41,300. This group is clearly visible on the right-hand side of the scatterplot below, in red.
 Comparatively, 82 zip codes would see increases in premium subsidies between $500 and around $3,300. The average median age is 37 years old for this group, much younger than zip codes that lose subsidies, and their average median income is $56,472. 205 zip codes would gain between $5,000 and $7,000, all of whom are ineligible for ACA subsidies because of their higher incomes. These zip codes are represented in green in the scatter plot. The average median age of this group is 40, and the average median income is $78,342.
There are an additional 83 zip codes that lose or gain $500 or less as a result of replacing the ACA with the AHCA; one of those zip codes would receive no subsidies from either law due to a median household income above $150,000. Overall, this plan would negative impact most Minnesotans’ ability to pay for health insurance, particularly older and poorer Minnesotans.
Geographically, Greater Minnesota stands to lose the most under Trumpcare. The map below highlights the difference in subsidies between the AHCA and ACA by zip code, with the darkest blue representing areas where the average couple stands to lose $3,000 or more in subsidies and the lightest blue representing areas where the average couple would gain $3,000 or more in subsidies.
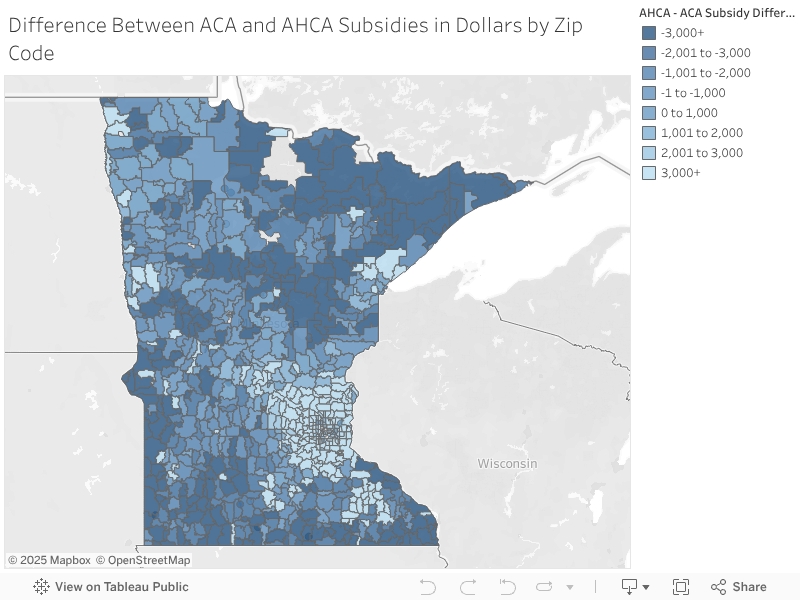
var divElement = document.getElementById(‘viz1493152311968’); var vizElement = divElement.getElementsByTagName(‘object’)[0]; vizElement.style.width=’100%’;vizElement.style.height=(divElement.offsetWidth*0.75)+’px’; var scriptElement = document.createElement(‘script’); scriptElement.src = ‘https://public.tableau.com/javascripts/api/viz_v1.js’; vizElement.parentNode.insertBefore(scriptElement, vizElement);
In fact, the top 20 zip codes with the greatest subsidy losses are all in Greater Minnesota. 16 of the top 20 zip codes in terms of subsidy losses under the AHCA are in Northern Minnesota, while the remaining four are in Western and Southern Minnesota. The table below represents the top 20 zip codes where subsidy losses are greatest in Minnesota.
| Top 20 Zip Codes with Largest Loss in Subsidies (AHCA vs. ACA) | |||
| Zip Code | Community | County | AHCA – ACA Subsidy Difference |
| 56669 | Kabetogama | Saint Louis, Koochiching | -$14,211 |
| 56688 | Pomroy | Itasca | -$14,095 |
| 56680 | Spring Lake | Itasca | -$12,948 |
| 56294 | Wanda | Redwood | -$12,850 |
| 56448 | Fifty Lakes | Crow Wing | -$12,416 |
| 56657 | Marcell | Itasca | -$12,012 |
| 55602 | Brimson | Lake, Saint Louis | -$11,478 |
| 56662 | Outing | Cass | -$11,457 |
| 55026 | Frontenac | Goodhue | -$11,346 |
| 56628 | Big Fork | Itasca | -$11,304 |
| 56450 | Garrison | Crow Wing, Mille Lacs | -$10,692 |
| 56142 | Ivanhoe | Lincoln | -$10,678 |
| 56447 | Emily | Crow Wing | -$10,633 |
| 56655 | Longville | Cass | -$9,899 |
| 56524 | Clitherall | Otter Tail | -$9,797 |
| 56588 | Vining | Otter Tail | -$9,711 |
| 55752 | Jacobson | Aitkin | -$9,577 |
| 55787 | Tamarack | Aitkin, Carlton | -$9,466 |
| 56755 | St. Vincent | Kittson | -$9,374 |
| 55781 | Side Lake | Saint Louis | -$9,114 |
In contrast, the bottom 10 zip codes (which gain the most from Trumpcare subsidies) are in Northern Minnesota, Western Minnesota, and the Twin Cities Metro. The median age in these communities is roughly the same age as the communities hit hardest by switching to the AHCA. The difference is that the median couple in these areas earn too much to qualify for ACA subsidies. The table below represents those zip codes. The average couple in these communities would receive $7,000 more in subsidies, while another 93 zip codes would receive $6,000.
| Top 10 Zip Codes with Largest Gain in Subsidies (AHCA vs. ACA) | |||
| Zip Code | Community | County | AHCA – ACA Subsidy Difference |
| 55001 | Afton | Washington | $7,000 |
| 55047 | Marine on St. Croix | Washington | $7,000 |
| 55073 | Scandia | Chisago, Washington | $7,000 |
| 55609 | Knife River | Lake | $7,000 |
| 55710 | Mountain Iron | Saint Louis | $7,000 |
| 55717 | Canyon | Saint Louis | $7,000 |
| 56249 | Fairfield | Swift | $7,000 |
| 56442 | Crosslake | Crow Wing | $7,000 |
| 56565 | Nashua | Traverse, Wilkin | $7,000 |
| 56629 | Fairland | Koochiching | $7,000 |
Allowing insurance companies to charge older and sicker people more like they did before the ACA became law is not in any conceivable way a better outcome than current law. If we are to “repeal and replace” the ACA, we should consider plans that make premiums more affordable, not less, and that provide more comprehensive care, not strip away provisions for maternity care, cancer treatment, or protections for those with pre-existing conditions.
Methodology
Using the US Census Bureau’s American Community Survey (ACS) 5-year estimates, we found the median income and age of individuals for all available zip codes in Minnesota. Using this information, we estimated the ACA premium subsidies by entering this information into the Kaiser Family Foundation’s Health Insurance Marketplace Calculator. The calculator accounts for zip code, income, the number of people applying for coverage, children, ages of adults applying, and smoking status to determine eligibility for Medicaid and subsidies. We compared this number to the Trumpcare subsidy, which is a flat rate bracketed by age. For those interested, see below for the results of all zip codes in Minnesota.
Estimated Difference in Subsidies between the AHCA and the ACA by Zip Code by North Star Policy Institute on Scribd
Limitations
We should note that there are some limitations within this research. Zip codes vary in size, so the reliability and applicability of each zip code’s median age and income can vary. Particularly small zip codes can lead to outlier results (median ages in the low teens) that are then excluded. Many zip codes did not even have median incomes listed by the US Census due to their small size. Additionally, this work assumes that the demographics that define an “average” person in a zip code match the “average” person who is uninsured or buys insurance through the exchange. This analysis also assumes that a couple with a median income and age are representative of a zip code. There are also 81 instances of zip codes having median incomes below 400% of poverty that consist of counties that are part of different ratings areas. These areas are pivotal in defining subsidy costs, so where a person lives within a zip code or town can have a drastic difference in ACA subsidy. In this article, zip codes in these instances were averaged between the two or three different ratings.
This analysis also does not examine the impact on zip codes that had median incomes below 200% of the poverty line, as they would be eligible for Medicaid or MinnesotaCare, both of which are public providers. This analysis also ignored zip codes with median ages below 20 or above 64. Zip codes with median ages at 18 or 19 are overwhelmingly on college campuses (and those individuals are likely insured by parents currently), or are eligible for the Children’s Health Insurance Program (CHIP). For those older than 64, these individuals are likely on Medicare, and none of the median incomes are small enough to still be eligible for Medicaid.
Additionally, this article only looks at changes in subsidies, not in actual premium costs or other changes from the ACA to the AHCA. The AHCA expands the ratio that insurance providers can charge older Americans from three times the cost for young people to five times. This means that these individuals’ premiums could drastically increase. Factoring in recent efforts to charge the sick for pre-existing conditions would exacerbate insurance costs for these individuals, and in all likelihood force them to give up insurance altogether. Finally, for those who are enrolled in health insurance through their employer, the Congressional Budget Office (CBO) estimates that the AHCA would lead to seven million people losing their employer-based care by 2026.